Hello steemians how are you? I hope you all are doing well and you all are safe and healthy during this pandemic time. Hope we all soon get the vaccine.
Today I go through one of the best and simplest language explanation homework posts by @sapwood on on-chain metrics. It's interesting to read the lecture post. Now I am Submitting my homework post to the professor.
HOMEWORK

QUESTION 1:
What is HODL wave, how do you calculate the age of a coin (BTC,LTC) in a UTXO accounting structure? How do you interpret a HODL wave in bull cycles?
Answer 1:
In the trading world, HODL is referred to as the hold of any asset by a trader or an investor. In this, we come across a new term named as HODL wave which is on-chain metrics that tells us the time in which BTC shows rally which means that a huge number of transactions take place during that time. After a huge rally till the peak, there is a large number of transactions and then BTC UTXO gets hold in in different wallets of a new owner for different time bands such as day, week, months, 1-2 years, 2-3 years, 3-5 years etc.
It tells about the holding and spending power of the owners. Hodl waves use different colours to flow different transactions.
Calculation of Age of coin:
To calculate coin age we have to know about its UTXO accounting that is unspent transaction output. We cannot calculate age of the coin with its mining date. The reason why we use unspent transaction output is that it is one of the smallest amount. It is a invisible part of any fait token. Let us see how UTXO help to find age of the coin.
Every time when BTC coins transfer from one wallet to another wallet there is a creation of unspent transaction output UTXO that is created by the network. So by the age of this UTXO we can easily calculate the age of BTC that when this particular coin more from this wallet to another wallet.
Now there are two type of age of hold coins. These ages are divided into two categories depending on the colour of the chat. One is hot colours and other one is cool colours.
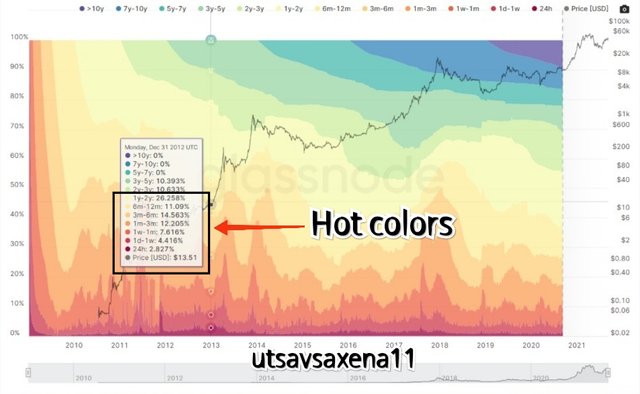
Hot colours :
These colours show recently holded coins activities. These are measured in the time band of 24 hours one day, one week, one month, 6 to 12 months.
As you can see that in starting days of BTC there is recent unmoved coins phase. From 24 hours to 1-2 years.
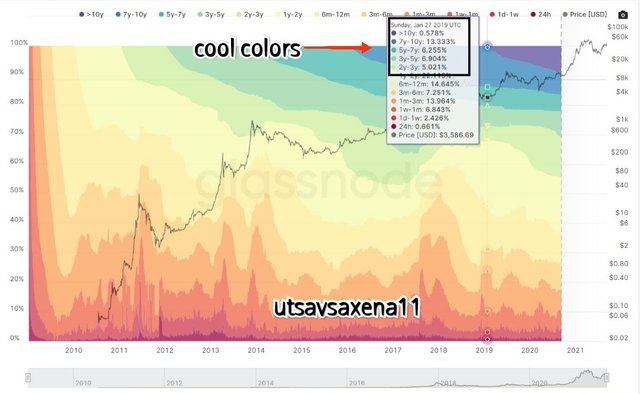
Cool colours:
These colours show old holded coins activities. These are measured in the time band of 1-2 years, 2-3 years and upto 10 years that can be only shown by Bitcoin as it is the oldest coin.
As you can see in the past few years BTC is in there old unmoved phase. It means people are holding it.
Interpretation of Bull cycle using HODL wave:
HODL wave is calculated by the ratio of unspent coin with equal value of demand and supply chain. This structure will tell us whether market facing bullish or bearish phase.
Hot colours indicates that new coins are holded in wallets and will get mature that is come in cool colours range after years age band. So it is not possible to find bullish trend with new holded hodl wave.
So to analyse bullish trend we have to check the older age band. If this old time band expands then it indicates that there are maximum number of unmoved coins. These coins are stored in different wallets. Now since more coins are unmoved this will reduce UTXO spending which will then reduce the supply.
Now apply the basic principle of demand and supply. If supply is limited and demand increase then it will lead to inflation in the market. Same happen in Hodl wave. When Unmoved coins increase, supply strictly reduced and to move unmoved coins demand increase which increase price and make a bullish trend in the market.
This is how a bullish phase is analysed in the market.
HODL chart move smooth in older time band phase.

QUESTION 2:
Consider the on-chain metrics-- Daily Active Addresses, Transaction Volume, NVT, Exchange Flow Balance & Supply on Exchanges as a percentage of Total Supply, etc, from any reliable source(Santiment, Coinmetrics, etc), and create a fundamental analysis model for any crypto[create a model for both short-term(up to 3 months) & long-term(more than a year) & compare] and determine the price trend (or correlate the data with the price trend)w.r.t. the on-chain metrics? Examples/Analysis/Screenshot?
Answer 2:
To create a fundamental analysis of A crypto coin based on daily active adress transaction volume exchange floor balance we are using coinmetrics and santiment source. This is a on chain mertices analysis. Before analysis let us understand how to visit these sites.
For coin mertices visit coin mertices official website. This website is quite slow and laggy so you can directly select the network data option that is also present on the main portal.
For santiment, Directly visit santiment.net. Create an account and start working on it.
Daily Active Addresses:
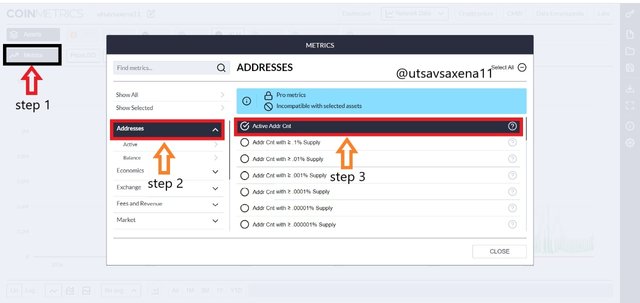
For daily active addresses we are using coinmetrics BTC chart. First we have to add active addresses. So click on mertices then there is a option named as address click on it and select Active addr cnt.
Now we have to make a fundamental analysis for short term that is around three months and for long term that is around one year or more.
Short term analysis:
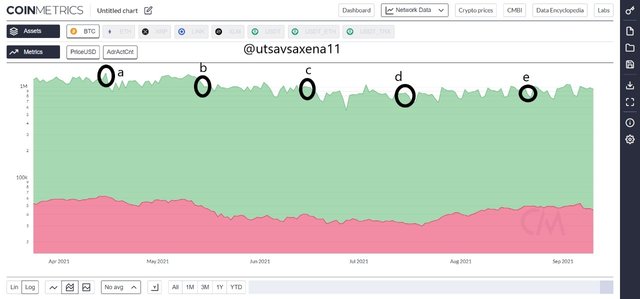
The circles at different points are are the peak of the active addresses on certain day. Let us make an analysis about the number of active addresses and the price of that current day.
| Peak | Date | Active Address | Price of BTC |
|---|---|---|---|
| A | 15-04-21 | 1.366M | 63.2K |
| B | 15-05-21 | 953.308K | 47.0k |
| C | 15-06-21 | 963.054K | 40.25k |
| D | 15-07-21 | 828.844K | 31.70k |
| E | 15-08-21 | 750.378K | 47.07K |
From the above table we can see that on 15th April at point A there are maximum number of active addresses. These addresses may be buying or selling at very huge amount.
From A to B point that is in 1 month active addresses fell down and drop white 30% which also affect the price which drop by 26%.
We can see this drop from 15th April to 15th July and if we take our analysis we can say that active addresses fell down by 39% and because of this price fall down by 50%.
From point D to point E active addresses are still reducing down by 9% but price gain and raise by 50%.
If we take the complete analysis of these months we can say that active addresses drop down by 45% and price drop by 25%.
long term analysis:
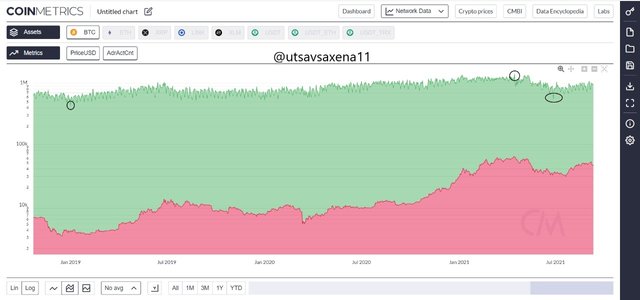
In long term chart of Bitcoin we are taking two situations in which we are taking the lowest and the highest active address. Secondly, we will be taking two points from correction Market phase of Bitcoin this year.
Lowest point : 1st january 2019
Active addresses: 433.715K
Price: 3,808.118
Highest point : 15th April 2021
Active addresses: 1.366 M
Price: 63K
As we can see that from 2019 to 2021 there is use gain in the active addresses as well as price. Active addresses gain by 208% and price of Bitcoin increased by 1475%.
Correction phase:
15th April 2021
Active addresses: 1.366 M
Price: 63K
27th June 2021
Active addresses: 518.219K
Price: 34.5K
As we can see in the correction face there is a drop in price by more than 50% and also we can see a drop in active addresses that is also more than 50% in between the correction phase.
So here we can conclude that in long term active addresses influencing the price that means with increase in active address price is also increasing but in short term it is not highly influenced but it is influenced.
NVT :
For NVT we are using coinmetrics BTC chart. First we have to add NVT. So click on mertices then there is a option named as economy click on it and select NVT.
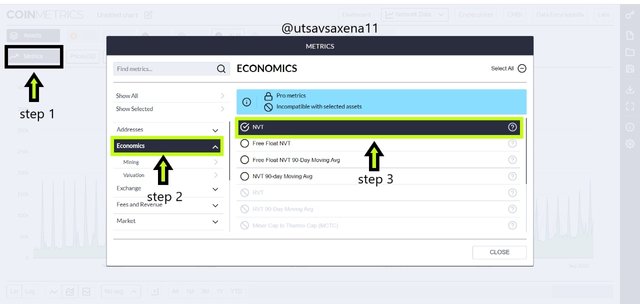
NVT is known as network value of transaction volume. It is the ratio of market capitalisation and the transaction volume of any asset on a particular day.
There are two conditions of network value of transaction volume. If its value is higher then the price is considered to be overvalued and if if its value is lower then the particular asset price is considered to be underrated or undervalued. If NVT is High it means that there must be a creation of bubble as network value and transaction volume both are increasing. But if it is lower then it means that transaction volume is increasing but network value is not increasing and hence the price will get undervalued.
In higher range as we stated that price is considered to be overvalued so it will move bearish and in undervalued that is lower range the price will move bullish.
Short term analysis:
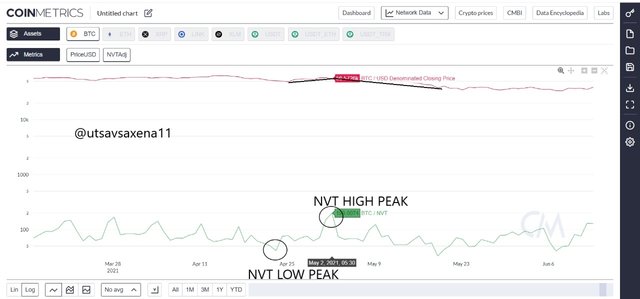
On 23 April 2021 NVT value is 41.226 and price of BTC is $50.95K. we can clearly see that NVT is lower and hence price will move up. Similarly on 2 May 2021, NVT value is 199 and price is $56.5726. clearly NVT value is large and price is over Value so price will move down.
Long term analysis:
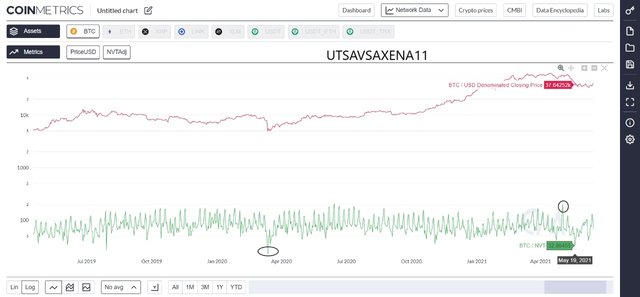
In long term trade using NVT on chain mertices we can analyse over value and under value that are bounded in an area. These bounded areas sometime shows dip and sometime shows uptrend. But if will analyse in more than years then we can clearly see e a huge price movement. But calculating undervalue and overvalue situations is quite difficult.
So NVT on long-term is not a a perfect indicator but it can be used with other indicators on chain mertices.
Exchange outflow Native unit:
Exchange outflow tell us about the the coin and its amount that how many coins are withdrawn from an exchange for deposit in an exchange. This indicator will show the clear relationship between the price movement and transfer of assets in exchange.
Short term analysis:
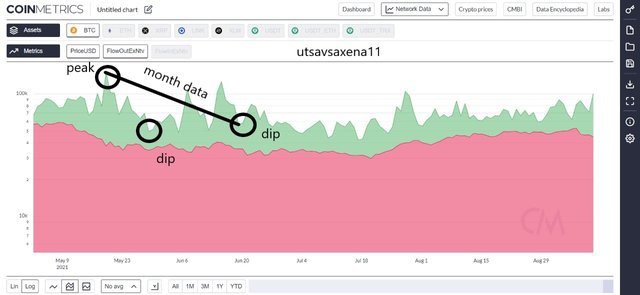
In the above chart in short term we created three zones for our analysis. Today's analysis and one month analysis.
On 19th May 2021, there is the withdrawal unit of Bitcoin as 113.5K and price on that day is $37.64K.
On 22nd May 2021, There is the withdrawal unit of BTC as 30.22 K with price $37.64K. so we can clearly see that there is a DIP in withdrawal unit of Bitcoin from exchange is but price remains in a same constant level.
Now if we analyse 19th may 2021 and 19th June 2021 then, 19th June 2021 withdrawal unit of Bitcoin is 21.43013K and price is $35.55K. so within one month there is a DIP of 81% in withdrawal unit of Bitcoin from exchanges and because of this price also decrease by 5%.
So with the decrease in withdrawal unit or deposite unit price also changes.
Long term analysis:
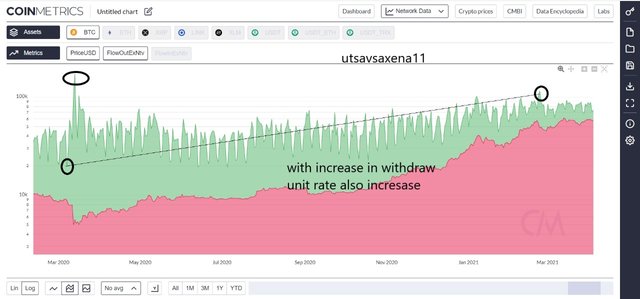
We are taking one year analysis from 7th March 2020 to 23rd February 2021. On 7th March 2020 withdraw unit of BTC is 10.49K and price is around 9K. On 23rd February 2021 withdrawal unit is around 67.07K and Price is around $48.56K. to be can clearly see that within an year with increase in withdrawal from the exchange is this increased the price of the Bitcoin by 433%. The thing is that withdrawal unit also move to high peaks in between these days. Highest record peak is 166K.
Show with the increase in in out flow price will also increase.
Netflow of the asset on exchange:
Netflow will tell us about the total flow of deposit and withdrawal on an exchange. This will predict the the price with the net of the the deposit and withdrawal on an exchange.
Short term analysis:
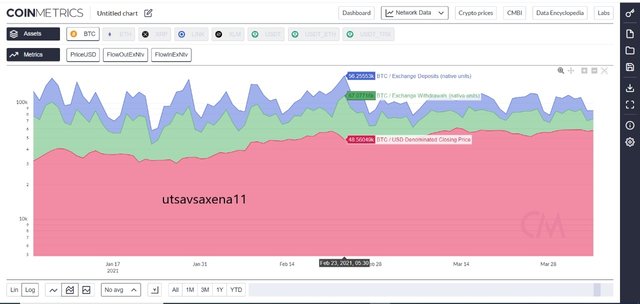
In short time period we are taking one month analysis from 23rd feb to 31st March 2021. In which on 23rd February Price is $48K with deposit btc 56.02K and withdrawal BTC as 67.0K. The net flow will be -10.98K. Similarly on 31 March 2021 price is $58.7K with deposit BTC as 28.75K and withdrawal BTC as 29.32K. So net flow is -0.57K. as we can see that withdrawal amount is more this will increase the price of the asset.
Long term analysis:
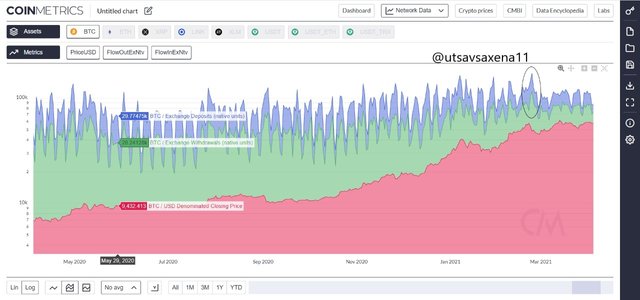
For long term analysis we are taking 29 may 2020 to 23 Feb 2021. On 29 may 2020 price is $9.4K and Withdrawal amount is 28.24K with total deposit BTC on Exchange is 29.77 K. Net flow is 1.53K. On 23 Feb 2021 price is $48.5K and Withdrawal amount is 67.07K with total deposit BTC on Exchange is 56.25K. Net flow is -10.82K. as we can see that withdrawal and deposit on Exchange increases is this reflect on uptrend of the price from 9000 to 50000 dollar.
Transaction volume:
Transaction volume on on-chain mertices is the amount of transaction takes place buy an asset in the market. This will also impact the price Trend. Let us see how transaction volume is related to the price movement in both short term and long term analysis.
To add transaction volume mertices we have to select the btc chart. This transaction volume mertices is not available on coin mertices so it is important to use santiment on-chain To work on transaction volume. Select transaction volume from mertices and apply it on chart.
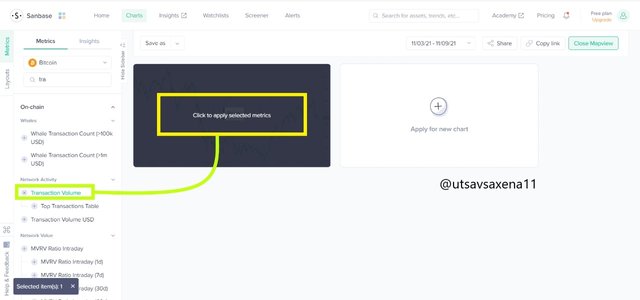
Short term analysis:
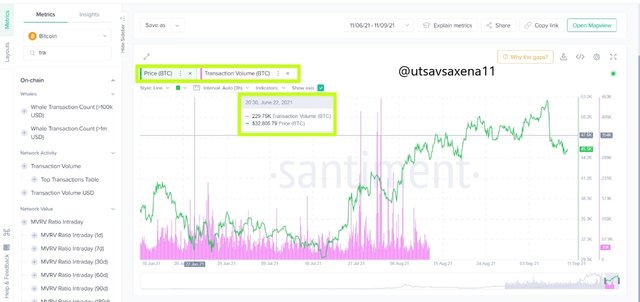
We are taking three situations which we can easily used to predict the relationship between the transaction volume and price movement. On 22nd June 2021 transaction volume is 229.75K and price of BTC was $32,805. Moving further on 28 July 2021 the transaction volume increased to 423.99K and that time the price was $38,984. This reach on 1st August at 1.05M with price $41,594.
So we can clearly see that with increase in transaction volume price of Bitcoin asset also increases.
Long term analysis:
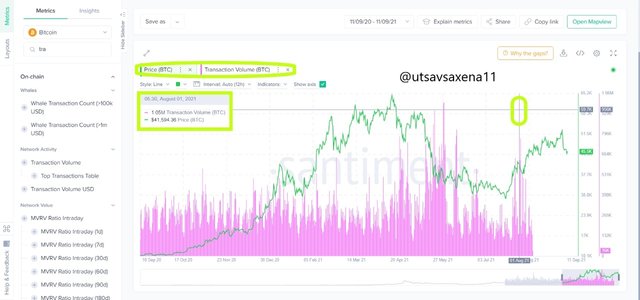
In long term we can see that everyday the transaction volume increasing and reach maximum of 1.05M in August 2021, this shows that with increase in transaction volume price of the Bitcoin asset also increasing rapidly and correcting itself.
Observation:
I can clearly observed that on many parameters other than trading price of a crypto asset are depending. These assets are not only depends on sentiment, buy and sell but also depend on on-chain metrics. Starting from supply to holding from exchange to trading volume on every point an asset price depends.

QUESTION 3:
Are the on-chain metrics that you have chosen helpful for short-term or medium-term or long term(or all)? Are they explicit w.r.t price action? What are its limitations? Examples/Screenshot?
Answer 3:
We have use many indicators in on-chain mertices and in my opinion every indicator work well in different time period. For example, Daily Active address and transaction volume are best in short term and medium term time frame because one can use this signals very easily and these are directly connected to the price action.
Other indicators like NVT, Outflow, exchange can be used in long term projections like 1-2 years, 2-3 years. These signals are distortion free e and make clear projections that one can use for the price prediction and fundamental analysis.
When we are using on chain mertices we also have to combine our daily updates news to get confirmed and completely updated with price prediction and action.
On-chain mertices are related to the price of an asset. The factor is the demand and supply that connect the price action and the on chain metrics. Price action is the strong interaction between buyer and seller in the crypto market exchanges that are han based on demand and supply. If the number of holders in the market increase and supply decrease so with increase in demand the price of the asset also increases. So it's clear that On-chain mertices are explicit with the price action.
Limitations:
- Limited data and platforms:
Because of limited data and platforms on-chain mertices aur not in very much use. Also show some of the assets don't have all the features to make an analysis of the price. For example : in coinmetrics if we choose XMR then we are not able to use exchange and other on-chain features.
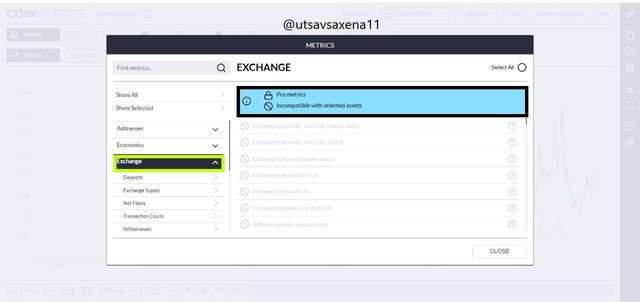
- Generate false signals:
Sometimes due to hai transaction volume or other factors on-chain mertices generate unclear distorted false signals in short term and medium term trading time periods. The signals maybe divergence or incomplete.

Conclusion
It is time to conclude our homework post in which we discuss about HODL wave and on-chain mertices. Hodl wave tell us about holding of asset in an exchange by owners and buyers. Where as on-chain mertices is a indicator set up that is use to analyse price and predict it using features like NVT, transaction volume, daily active adresses and so onn.
Many of the features are directly proportional to the price movement. For example with increase in transaction volume price of the asset increases. There are only few limitations related to its premium pack of different mertices sites. Many of the assets are also not listed and should be listed as soon as possible. Thank you so much professor for Such an interesting lecture post that provide us great information and practical understanding of on-chain mertices.

.jpeg)
