I sincerely hope that everyone enjoys the educational themes of the Steemit Engagement Challenge S14-W4. subsequently, the competitors' epic entries under the designated subject. I was eager to learn more about this new topic, so I did some research and shared my own opinions with you all. I hope that my contribution will also be valuable.
In your own words, what are Fibonacci Retracements and what are they used for?
Accordingly to research on it , I came to know that Fibonacci retracements are a type of technical analysis tool that can be used to determine possible financial market support or resistance levels. Trades can be made using these indicators, which are based on the Fibonacci sequence and ratios, to help determine entry and exit points by predicting where a price may retrace or pull back after a trend.
Fibonacci Retracements is because of a technical analysis tool which is used in financial markets highlighted the significant Fibonacci levels such as 38.2%, 50%, and 61.8%, They entail drawing horizontal lines on a price chart. When deciding whether to enter or exit a trade in response to price corrections within a trend, traders utilize these levels to pinpoint probable areas of support or resistance.
Explain the most important Fibonacci levels and show at least one example on a chart of a cryptocurrency pair.
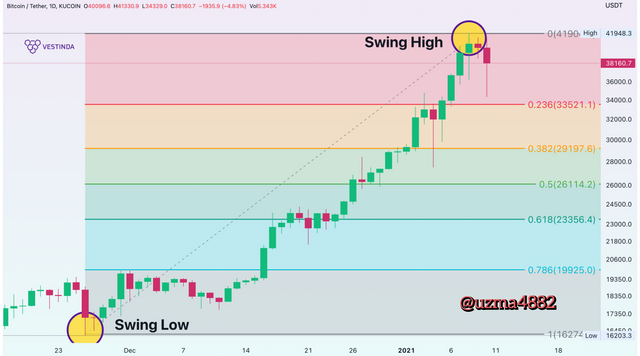
Fibonacci retracement levels 23.6%, 38.2%, 50%, and 61.8% are usually the most significant and in practice in trading. Traders frequently employ these levels, which come from the Fibonacci sequence, in technical analysis.

Let's look at a fictitious example noted on January 8th, 2021 at a price of $41,904.Where Traders can use a cryptocurrency pair, like Bitcoin (BTC) versus the US Dollar (USD). The Fibonacci retracement levels are shown by the horizontal lines in this chart. To help them decide when to enter or exit the market, traders can watch how the price moves in relation to these levels.By clicking on this link you can get in deep acknowledgement about the importance of these levels in detail.
Use the STEEM/USDT chart and show how Fibonacci retracements work.
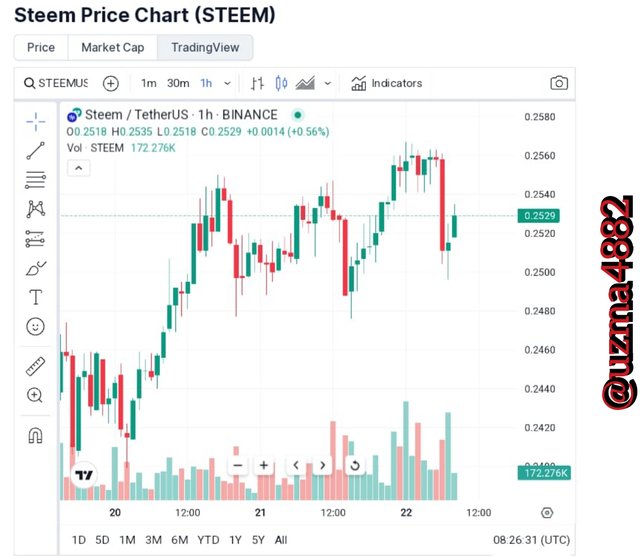
Here's with going to share with you Steem/USDT pairs chart in which levels of Fibonacci retracements workouts. Right now the top level of Fibonacci retracements shows $0.25 level which is fluctuate after passing passing 30mintus .

CoinGecko is an other very accurate tool through using it we can acknowledge the statistical levels of Fibonacci Retracements can check by paring Steem/USDT. Here's with traders ought to integrate their limitations into a thorough trading strategy and be conscious of them by experiencing their trading accordingly to it.
Advantages and disadvantages of Fibonacci retracements.
Here's with going to share some important facts that's reflects to the advantages and disadvantages of Fibonacci Retracements.
| Advantages | Disadvantages |
|---|---|
| Fibonacci retracements give traders objective levels on a chart, which facilitates the identification of possible areas of support and resistance. | Different traders may interpret the retracement levels differently depending on how subjectively the trend points (swing highs and swing lows) are chosen. |
| Many traders utilize retracement levels, potentially leading to self-fulfilling prophecies and altering market behavior when numerous traders monitor the same levels. | Fibonacci retracements can be useful in predicting market behavior, but relying solely on these levels without considering other factors could lead to incorrect conclusions. |
| A visual tool known as Fibonacci retracement levels helps traders determine entry or exit points by using past price movements. | Fibonacci retracements may not be suitable for all market situations, especially during extreme volatility or unexpected news events. |
Well, Fibonacci retracements are commonly used in cryptocurrency trading, but should be combined with other strategies like risk management, fundamental analysis, and market sentiment for success on the basis of its advantages and disadvantages.
| Kind Regards 💐 @uzma4882 |
|---|

Resaltas los niveles 38,2%, 50% y 61,8% como los niveles de retroceso de Fibonacci más significativos en el análisis técnico. Similarmente has demostrado su aplicación en el par Steem/USD y descrito además las ventajas y desventajas de esta herramienta.
Una de las grandes ventajas de esta herramienta es que facilita la identificación de las posibles áreas de soporte o resistencia, para orientar a los traders en su decisión de entrar o salir.
Gracias por compartir.
Te deseo mucha suerte y éxitos.
Downvoting a post can decrease pending rewards and make it less visible. Common reasons:
Submit
Your comment has been successfully curated by @sduttaskitchen at 5%.
Downvoting a post can decrease pending rewards and make it less visible. Common reasons:
Submit
Your post has been successfully curated by @sduttaskitchen at 35%.
Thanks for setting your post to 25% for @null.
We invite you to strive to publish quality content.
It could qualify you to be nominated for the weekly Top of our curation team.
Burning STEEM by sending it to the @null account helps reduce the supply of STEEM and so increases its price.
Downvoting a post can decrease pending rewards and make it less visible. Common reasons:
Submit
Thanks for sharing your love through support my publication 💐
Downvoting a post can decrease pending rewards and make it less visible. Common reasons:
Submit
Saludos cordiales estimada amiga uzma4882.
Una herramienta dentro del analisis tecnico, que como indicas nos muestras los soportes y resistencias en el precio de un activo, de esta manera nos permite analizar posibles tendencias alcistas o bajistas, permitiendo así tomar una decisión de cuando entrar o salir de una posición.
Buenas imágenes y buen análisis de este indicador, te deseo mucha suerte y éxitos.
Downvoting a post can decrease pending rewards and make it less visible. Common reasons:
Submit
Hola Saludos! Su análisis profundo y su perspectiva significativa sobre mi publicación son precisos. Me alegra mucho ver sus valiosos comentarios y gracias por desearme que tenga éxito. Dios te bendiga a ti también.
Downvoting a post can decrease pending rewards and make it less visible. Common reasons:
Submit
Greetings dear @uzma4882!
Your explanation of Fibonacci retracements is insightful, offering a clear understanding of how these levels are used in trading.
Sharing more detailed examples and potential impacts on cryptocurrency pairs would elevate your already informative posts! Keep up the great work!
All the best in the contest—success for you! 👍
Downvoting a post can decrease pending rewards and make it less visible. Common reasons:
Submit
Thank you Steemit fellow! For in detail review and shared your valuable feedback. It's appreciated. Good luck to you.
Downvoting a post can decrease pending rewards and make it less visible. Common reasons:
Submit
¡Hola @uzma4882!
Gracias por compartir tus conocimientos sobre los niveles de Fibonacci retracements en el contexto del Steemit Crypto Academy Contest. 📈👏 Tu explicación clara y concisa sobre qué son y cómo se utilizan es muy útil para aquellos que desean comprender mejor esta herramienta de análisis técnico.
La elección de utilizar el par STEEM/USDT para mostrar cómo funcionan los retracements de Fibonacci es acertada, y la inclusión de un ejemplo en el gráfico agrega un valor significativo a tu entrada. 📊💡
También aprecio que hayas destacado tanto las ventajas como las desventajas de utilizar Fibonacci retracements. Esto brinda a los lectores una visión equilibrada de la herramienta y enfatiza la importancia de combinarla con otras estrategias para tomar decisiones informadas en el trading de criptomonedas. 🔄💼
¡Sigue participando y compartiendo tu conocimiento en la Steemit Crypto Academy! 🚀🌟
Downvoting a post can decrease pending rewards and make it less visible. Common reasons:
Submit
Your breakdown of Fibonacci retracements is really insightful. It gives a clear understanding of how these levels are used in trading. Your post was informative and your ideas were amazing. Keep up the great work, and I wish you all the success in the contest.
Downvoting a post can decrease pending rewards and make it less visible. Common reasons:
Submit
Upvoted. Thank You for sending some of your rewards to @null. It will make Steem stronger.
Downvoting a post can decrease pending rewards and make it less visible. Common reasons:
Submit
https://twitter.com/UShaharyaar/status/1738169375474233826?t=JTaMgB33e1UYV43mDXQmMA&s=19
Downvoting a post can decrease pending rewards and make it less visible. Common reasons:
Submit
Absolutely, your emphasis on combining Fibonacci retracements with other strategies like risk management, fundamental analysis, and market sentiment is spot on.
Success in cryptocurrency trading often relies on a comprehensive approach that takes into account various factors. Integrating Fibonacci retracements into a broader trading strategy enhances decision-making and risk mitigation. Great insight!
Downvoting a post can decrease pending rewards and make it less visible. Common reasons:
Submit
Apne topic ko bahut acchi Tarah se cover Kiya hai aur mujhe aapke har baat se agreement hai kya aapane bilkul theek kaha hai ki yah hamare pass ek aisa technical analysis tool hai jiske through ham aur khas taur per traders bahut acchi Tarah se andaza Laga sakte hain ki kab market mein prices increase hongi aur kab decrease Hogi aur uske mutabik Koi decision making bhi kar sakte hain Jo ek bahut bada fayda hai
Aapane proper tarike se screenshot ko elaborate Kiya hai aur hamen is topic implement Karke dikhaya hai jo ki bahut hi interesting lag raha hai aur iske alava aapane advantages aur disadvantages ko bhi completely explain Kiya hai aur yah sab aapke knowledge aur research ko show karta hai main aapko aapki mehnat per good Luck kahta hun
Downvoting a post can decrease pending rewards and make it less visible. Common reasons:
Submit
Hey friend
I must say I really love how you broke down this theory known as Fibonacci retracement strategy from your post is obvious that you understood the topic so well to the extent that you can easily see someone else about Fibonacci retracement strategy.
Thanks for sharing wishing you success, please engage on my entry https://steemit.com/hive-108451/@starrchris/steemit-crypto-academy-contest-s14w4-fibonacci-retracements
Downvoting a post can decrease pending rewards and make it less visible. Common reasons:
Submit
In simple terms, a Fibonacci retracement is a line that is drawn on a chart to show the potential areas where the price is likely to bounce back up or down. This line is based on the Fibonacci sequence, a mathematical sequence that is found in nature. While it may seem complex, the idea behind Fibonacci retracements is actually quite simple....
I'm so glad that with your proper and detailed explanation, I came to a point of understanding how the tool works on the STEEM USDT pair. I understand clearly everything and thanks to you...
Fibonacci retracements can be very useful, but they do have some drawbacks. One advantage is that they can help you identify levels where the price is likely to bounce back, which can help you make more informed trading decisions. However, one disadvantage is that they are based on historical data, so they are not always reliable. Additionally, they should be used in conjunction with other forms of analysis, such as fundamental analysis, to get a more complete picture of the market.
Thanks for sharing and good luck with the challenge....
Downvoting a post can decrease pending rewards and make it less visible. Common reasons:
Submit
I'm very glad and impressed with your point of view about the FRs and their working. Yes you are right that the FRs are very useful technical analysis tools to understand the market trends of different crypto currencies. Your publication is really very interesting and thank you so much for sharing with us 😊
Downvoting a post can decrease pending rewards and make it less visible. Common reasons:
Submit