1a) EXPLAIN THE JAPANESE CANDLESTICK CHART?(Original screenshot required)
b) IN YOUR OWN WORDS, EXPLAIN WHY THE JAPANESE CANDLESTICK CHART IS THE MOST USED IN THE FINICIAL MARKET
c) DESCRIBE A BULLISH AND A BEARISH CANDLE. ALSO, EXPLAIN ITS ANATOMY. (Original screenshot required)
Source

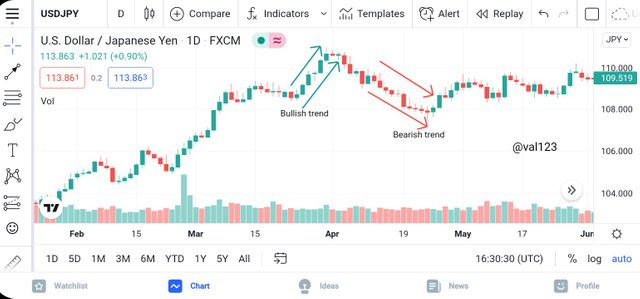
Most traders make use of the Japanese candlestick chart to analyze market Movement. Furthermore, the Japanese candlestick chart is kind of chart whereby traders makes use of it to monitor price motion on the chart. Japanese candlestick was created or founded by a Japanese rice trader **Steve Nison. Using Japanese candlestick, traders can easily understand the movement of market in a given timeframe, just by looking at it. Hows that possible? Well, the Japanese candlestick is very visible, it's colour differentiate the uptrend and downtrend movement, with this, traders can decided the perfect time to buy or sell crypto coins.
Japanese candlestick can be very simple to operate, on the other hand, it provides all details and information about market movement. Most traders makes use of Japanese candlestick to predict what the value if a particular market or coin rather, will be in future. The Japanese candlestick chart specifies the opening and close, the low and high price in a particular period of time. Also, note that when the close goes higher more than the open price, it indicates or shows traders that the market is experiencing uptrend motion ( Bullish Trend ) this will make it's body to change to green colour, but when the close goes lower or below more than the open price, it shows or tells traders that the market is experiencing downtrend motion ( bearish trend ) this will make the body to change into red colour.

Normally, the Japanese candlestick chart are mostly used in finicial market. Below are some of the reasons for that.÷
It's often used by traders, because they make use of it in analysing the movement of market, identifying wether the market is bullishing or bearishing. It tell who's controlling the market price or movement between buyers and sellers.
Using Japanese candlestick chart, traders understands the market, whenever they just look at it i.e it is very simple to sense or graps.
The Japanese candlestick charts indulge or gives full information on price market and it's movement.
making use of japanese candlestick, it tells traders the perfect time to buy or sell crypto asset.

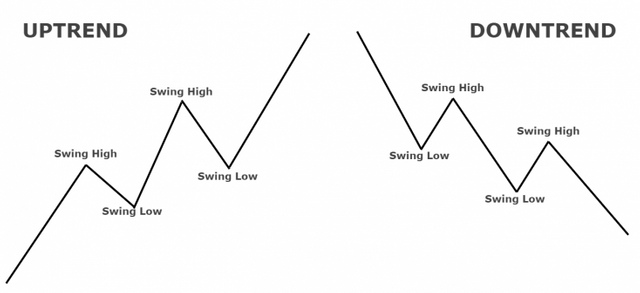
BULLISH CANDLESTICK
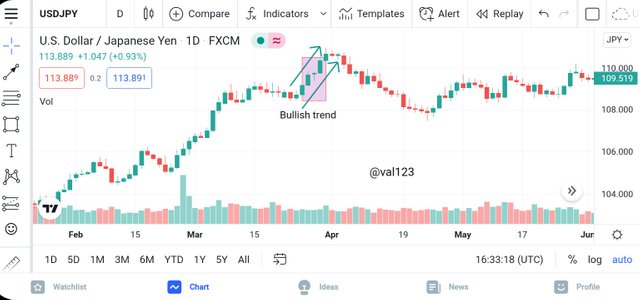
Bullish candlestick is always green or white in colour, it indicates the positive move in crypto market i.e when the market is bullishing, is said to be that the market is in uptrend movement. It indicates or tell the buyers have taking over the market. This mostly happens when a crypto asset is being purchased by traders, it will make the value of the coin to rise more. The stockholder always know that the market price will rise whenver the body of the candlestick turns green. So, when the market is bullishing it indicates a positive movement in market chart.
BULLISH ANATOMY
It consist of the open, close, high and low.
The open÷ The open displays the first price on crypto token in a given term. It is found below the bullish candlestick.
The close÷ The close displays the end price on crypto token in a given term. It is found above the bullish candlestick.
High÷ It displays the highest or maximum crypto token purchased in a given term.
Low÷ It displays the lowest or minimum crypto token purchased in a given term.
BEARISH CANDLESTICK
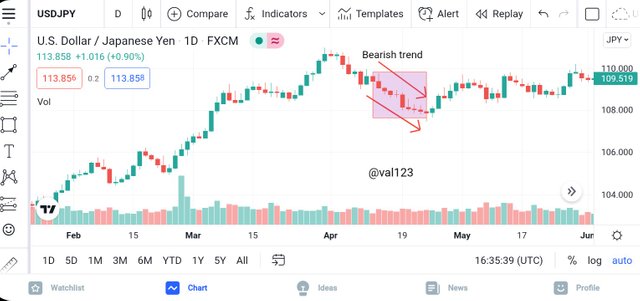
Bearish candlestick is always red or black in colour, it indicates the negative move in crypto market i.e when the market is bearishing, is said to be that the market is in downtrend movement. It indicates or tell that sellers have taking over the market. This mostly happens when a crypto asset is being sold by traders, it will make the value of the coin to decrease. The stockholder always know that the market price will fall whenver the body of the candlestick turns red. So, when the market is bearishing it indicates a negative movement in market chart.
BEARISH ANATOMY
It consist of the open, close, high and low.
The open÷ The open displays the first price on crypto token in a given term. It is found above the bullish candlestick.
The close÷ The close displays the end price on crypto token in a given term. It is found below the bullish candlestick.
High÷ It displays the highest or maximum crypto token purchased in a given term.
Low÷ It displays the lowest or minimum crypto token purchased in a given term.
CONCLUSION
Making use of the japanese candlestick, is very important. It is very easy to undestand and also to operate, most trader makes use of it to analyze market and also predict future price of a token. I really appreciate for the wonderful and benefitting lecture.
Thanks for reading.
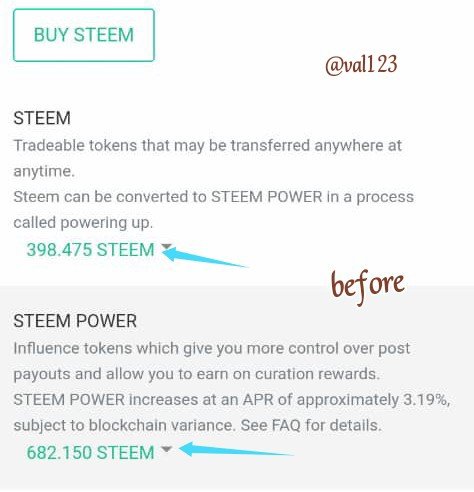
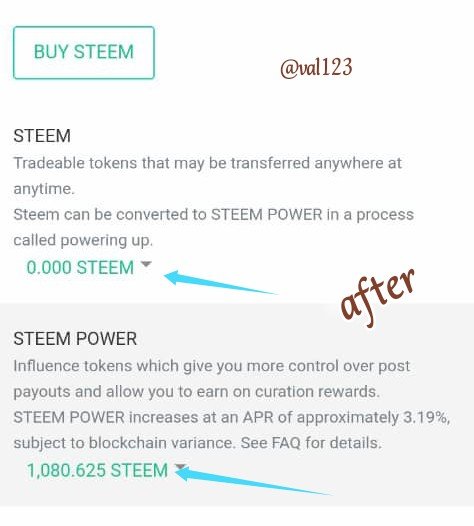
POWERED UP 398.475 STEEMS
#club5050 😀
Downvoting a post can decrease pending rewards and make it less visible. Common reasons:
Submit