


Hey guys!
Greetings from me, i welcome you all to the season 6 week 2 of the steemit cryptoacademy. It's a great privilege to be part of this wonderful lecture by professor @imagen. The lecture was about how we can trade with double top and wedges. Below is my entry for this homework post.

Q1. EXPLAIN IN YOUR OWN WORDS THE CONCEPT OF DOUBLE TOP, DOUBLE BOTTOM AND WEDGES. HOW TO INTERPRET EACH ONE?

They are many technical analysis traders carries out in other to predict the future movement of the market. I will be explaining the **Double top, Double Buttom and Wedges. Lets go.
Double top is seen as technical analysis traders use to analyze the market movement in future. Double top is usually inform of letter M. Now the double top, is seen as a bearish movement or trend because when the market goes high and hit your resistance level and comes down a little and then hit the resistance level the second time and reversed, this is the best time for a trader to take a short position in the market.
Although, not all double top give an accurate bearish signal, some are false signal, some may reverse back to uptrend after hitting the resistance level the second time and by then a trader would have made an entry. So now my opinion is , when this pattern is formed, a trader should wait to confirm the trend first before entry. Confirming the trend is just waiting for at least 3 red candles to form. We can simply identify double top without any stress. Lets see screenshot i provided below.
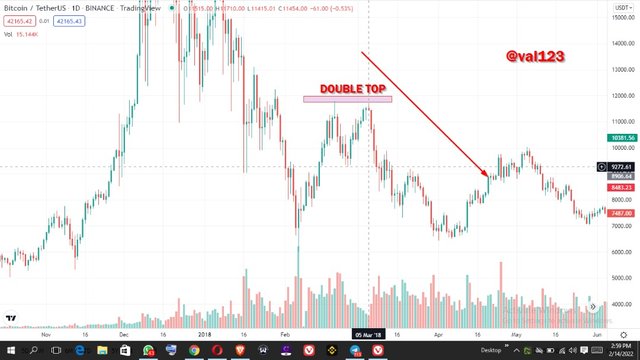
So, looking at the chart above, this is a double top pattern which signals a bearish trend. The market was trending up till it reaches at a point and start going down. This point serves as resistance level. When the market trends down a little, it goes up again and hit the resistance level the second time and starts trending down. At this point, traders are adviced to take a short position.
Double bottom is just the opposite of double top. Double buttom is seen as technical analysis traders use to analyze the market movement in future. Double buttom is usually inform of letter W. Now the double buttom, is seen as a bullish movement or trend because when the market goes down and hit yout support level and goes up a little and then hit the support level the second time and reversed, this is the best time for a trader to take a long position in the market.
Although, not all double buttom give an accurate bullish signal, some are false signal, some may reverse back to downtrend after hitting the support level the second time and by then a trader would have made an entry. So now my opinion is , when this pattern is formed, a trader should wait to confirm the trend first before entry. Confirming the trend is just waiting for at least 3 green candles to form. We can simply identify double buttom without any stress. Lets see screenshot i provided below.
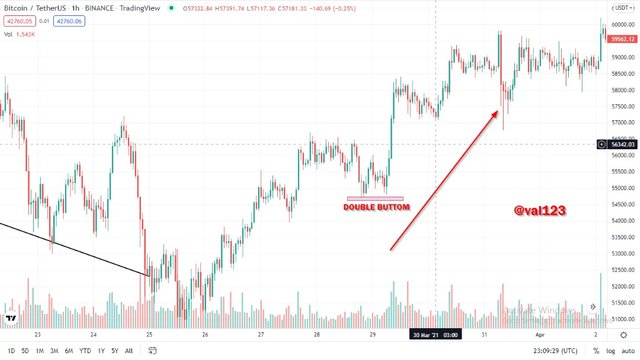
So, looking at the chart above, this is a double button pattern which signals a bullish trend. The market was trending downwards till it reaches at a point and start going up. This point serves as support level. When the market trends up a little, it goes down again and hit the support level the second time and starts trending upward. At this point, traders are adviced to take a long position.
Wedges are also technical analysis traders carries out in order to predict the future trend of the market. Wedges are being drawn either with two trendlines going downwards or two trendlines going upward. These two type of wedges are called The rising wedge and Falling Wedge i will explain the two type of wedges we have.
RISING WEDGE
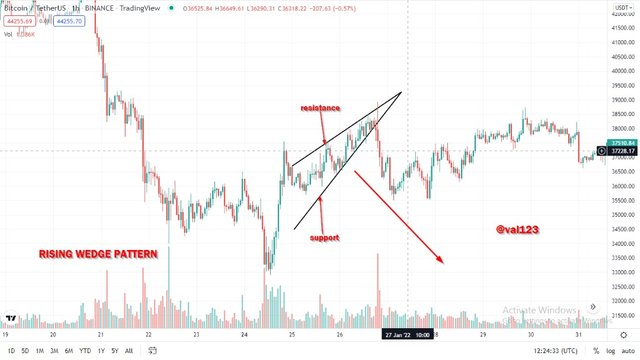
The rising wedge are analysis based on predicting a downtrend movement. When this analysis is being carried out, traders are expected to take a short position on the market. This pattern contains two rising trendlines serving as support and resistance point, whereby the market hits the both line going up and down, till a breakout occurs in the support level and the market will start bearishing. Lets look at example of rising wedge pattern.
FALLING WEDGE
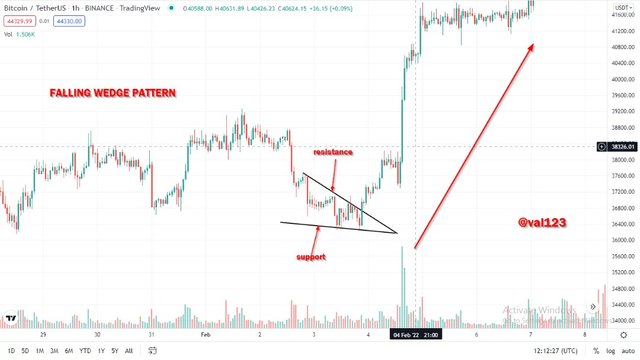
The falling wedge pattern is also the opposite of rising wedge pattern. The falling wedge are analysis based on predicting an uptrend movement. When this analysis is being carried out, traders are expected to take a long position in the market. This pattern contains two falling trendlines serving as support and resistance point, whereby the market hits the both line going up and down, till a breakout occurs in the resistance level and the market will start bullishing. Lets look at example of falling wedge pattern.

Q2. MAIN DIFFERENCES BETWEEN THE DOUBLE TOP AND THE DOUBLE BOTTOM. SHOW SCREENSHOTS.

I will explain the difference between double top and double buttom.
Double Top
Double top are inform of M, whereby the price moves up to the resistance level, then come down a little and trend up again hitting the resistance level the second time. When this type of pattern is formed, and a reverse occurs, we normally take a short position on the market.

Double Buttom
Double buttom are inform of W, whereby the price moves down to the support level, then goes up a little and trend down again hitting the support level the second time. When this type of pattern is formed, and a reverse occurs, we normally take a long position on the market.


Q3. EXPLAIN AND HIGHLIGHT THE MAIN DIFFERENCES BETWEEN A BULLISH WEDGE AND A BEARISH WEDGE. SHOW SCREENSHOTS OF EACH.

I will explain the difference between bullish wedge and bearish wedge pattern in my own understanding.
Bullish Wedge
First of all, bullish wedge is also a falling wedge pattern, because, when a falling wedge pattern is formed, the market tends to go bullish.
This falling wedge pattern is being formed with 2 trendline which are moving downward. The breakout always occur at the resistance level and the market will start bullishing. The market will first of all trends down, hitting the both trendline till it goes up breaking the trendline at the resistance level. Lets see screenshot below.

Bearish Wedge
First of all, bearish wedge is also a rising wedge pattern, because, when a rising wedge pattern is formed, the market tends to go bearish.
This rising wedge pattern is being formed with 2 trendline which are moving upward. The breakout always occur at the support level and the market will start bearishing. The market will first of all trends up, hitting the both trendline till it goes down breaking the trendline at the support level. Lets see screenshot below.


Q4. EXPLAIN THE VOLATILITY THAT USUALLY EXISTS WITH RESPECT TO THE VOLUME IN THE WEDGES. WHEN IS THERE USUALLY MORE VOLUME? WHAT HAPPENS IF A PULLBACK BREAKS THE SUPPORT OF A WEDGE?

Like i stated earlier, wedge consist of two different forms. Which are the rising and falling wedges.
Now, the rising wedges signals us a downtrend movement after the price had gone upward and buyers are no longer strong to push it more up, then there will be a reversal from uptrend to downtrend and this is when a breakout occurs in the support point.
Now, when the falling wedge occurs, there is no much volume when the market start trending up. These means that, the rising wedge has more volume when trending down immediately the breakout occurs than that of falling wedges.

Q5. FIND AND ANALYZE THE DOUBLE TOP PATTERN ON AT LEAST 2 CHARTS. SHOW YOUR OWN SCREENSHOTS.

First analysis on double top
In this section, i will analyze the double top pattern making use of BTCUSDT chart. Lets see the image below.
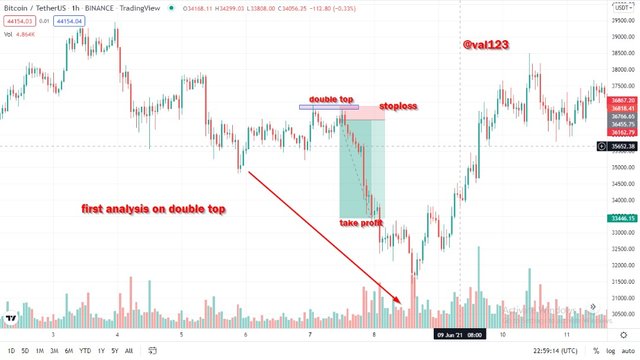
Let's pay attention to the chart i provided above. This is a BTCUSDT chart which i used in analyzing double top pattern. Double top signals a bearish trend in a given timeframe. Now, in the chart, i was able to find the double top. We can see how the market trends up a little and also comes down a little before going up the second time. Now once it hits the resistance point, it starts to bearish, then this was where i took my entry. As we can see how the market experienced a massive bearish trend and trader have made a lot of profit from this analysis carried out.
Second analysis on double top
I made another analysis based on double top using ETHUSDT chart. This is also similar to the first analysis i carried out. To show that double top signals a bearish trend. Lets see the image below.
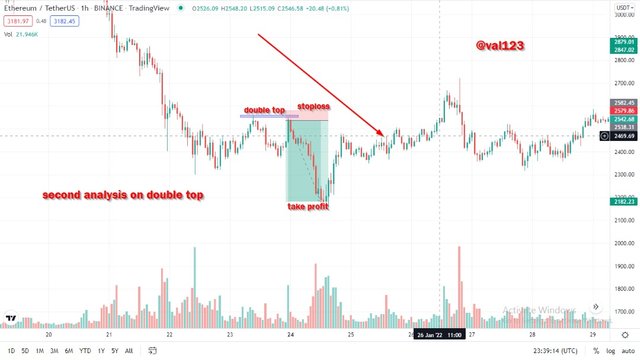
Double top are usually in form of M, as we can see on the chart i provide above. The market also trends the same way as BTCUSDT chart did. There must be atleast two point hitting the resistance level. With this, we can confirm the trend and take entry.

Q6. FIND AND ANALYZE AT LEAST 2 RISING WEDGES AND 2 FALLING WEDGES ON AT LEAST 2 CHARTS. SHOW YOUR OWN SCREENSHOTS.

First analysis on rising wedge pattern
In this section, i will analyze the rising wedge pattern, making use of BTCUSDT. Lets see the image below.
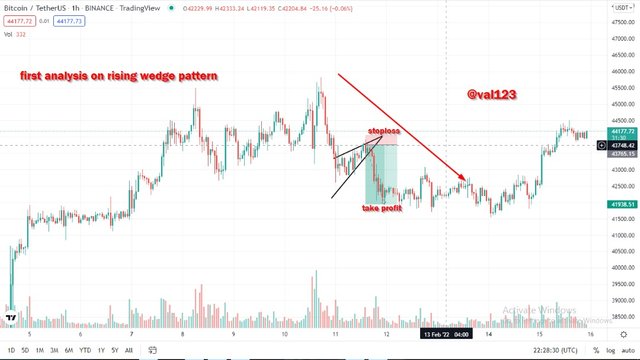
Lets pay lets see the chart i provided above. This is a rising wedge pattern, which usually signals a bearish trend in a given timeframe. Now, i made use of BTCUSDT chart to analyze the market with this type of pattern. We can see the two uptrending trendlines which i drew. This trendlines serves as support and resistance point. The market was trending a little bit up hitting the both trendlines without a breakout. Now till it gets to a point where the breakout occured at the support point, now this signal a downtrend movement and traders are opportuned or advice to take short position at this point.
second analysis on rising wedge pattern
This time, i will be making use of ETHUSDT for the analysis. Lets see the image below
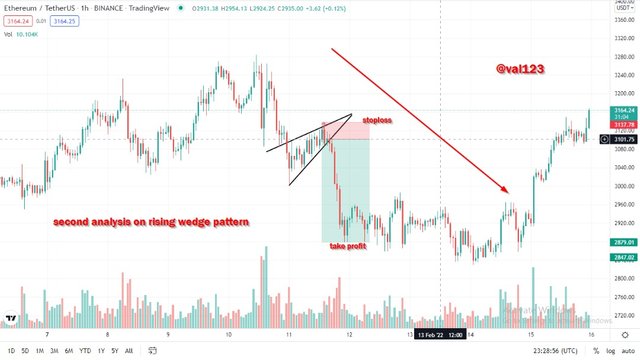
This is also similar to the first analysis, to show us that using rising wedge pattern, it signals to traders a bearish movement in a given period of time.
Analysis on falling wedge pattern
I will be making another analysis on falling wedge pattern. Lets se screenshot below.
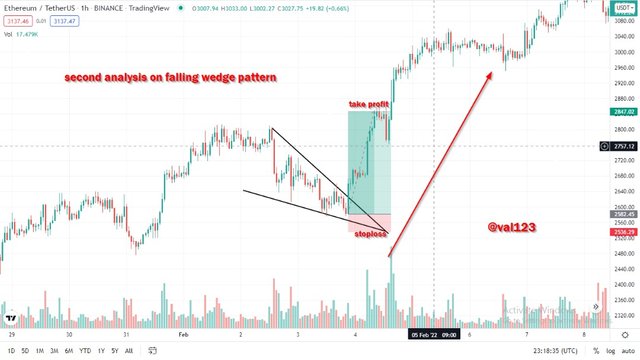
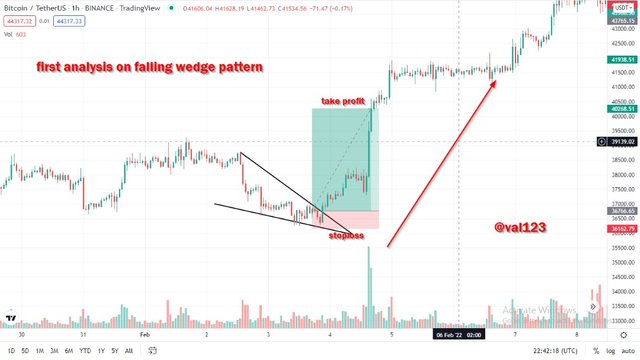
Falling wedge pattern is the opposite of rising wedge pattern. Looking at the chart above, is BTCUSDT and ETHUSDT chart. We can see the two downtrending trendlines which i drew. This trendlines serves as support and resistance point. The market was trending a little bit down hitting the both trendlines without a breakout. Now till it gets to a point where the breakout occured at the resistance point, now this signals an uptrend movement and traders are opportuned or adviced to take long position at this point.

Q7. IMPORTANCE OF PATTERNS IN TECHNICAL TRADING.

We should know that patterns are very important when trading. We also have types of pattern in trading which traders make use of. These patterns are chart patterns and candlestick pattern.
Candlestick stick pattern are also used by traders to predict the future movement of the market in a given period of time.
Chart patterns consist of technical analysis carried out by trader to also predict the future trend of the market e.g Double top, rising wedge and falling wedge pattern which professor @imagen taught about.
We have many kinds of chart pattern, this can be performed by making use of technical tool to analyze the market. This technical tools includes trendlines and other tools. Making use of pattern in technical trading help us to minimize loss while trading. It helps to know the perfect time to take our entry and the perfect time to exit the market.
With patterns, a trader can predict what next movement the market will take in a give time. Pattern help traders to trade breakouts. Though in order to make a good trading decison, we should also add some indicators to it, in order to get an accurate result.

Q8. DO YOU FIND IT EFFECTIVE TO USE THESE PATTERNS IN TRADING? JUSTIFY YOUR ANSWER

Well, for me i will say yes, because not all pattern are 100% accurate. Market are highly volatile, this patterns only helps us atleast to predict and minimize loss while trading. So, every pattern in trading are not 100% accurate, some may go against our prediction and this will lead to loosing money.
For me, the best thing to do is to trade with confluence, by adding both indicators along with the pattern in order to confirm a trend if its sure or not, than making use of only one pattern while trading. A trader should not base on a particular pattern when trading. Trading with confluence makes us to know the best time to enter the market and also being sure of the trade we are about to enter.
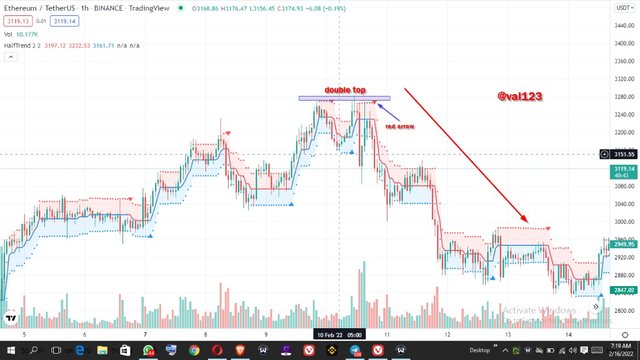
We can see the screenshot above. I made use of half trend indicator and double top pattern to analyze the market. We know that when a double top pattern is formed, it signals a downtrend movement. So now, the indicator i added also signals a downtrend by showing red arrow at the top side of the chart. So with this, i have confirmed a downtrend Movement in the market.
CONCLUSION
Trading with double top and wedge pattern is very good for traders to make use of. It helps in predicting future movement on the market price in a given period of time. Although this patterns are not 100% accurate, we should also try to add indicators along with it, in order to confirm the trend. All thanks to professor @imagen for a well detailed and benefitting lecture.
Cc-
Professor @imagen.
Gracias por participar en la Quinta Temporada de la Steemit Crypto Academy.
Espero seguir corrigiendo tus futuras asignaciones, un saludo.
Downvoting a post can decrease pending rewards and make it less visible. Common reasons:
Submit