
Q(1) DEFINE IN YOUR OWN WORDS, What Is The "STOCHASTIC OSCILLATOR"?

The Stochastic Oscillator which you can also be called Lane's stochastics or momentum indicator. is one of the indicators that a trader or financial analyst use to carry out technical analysis during trading.
A financial analyst, George Lane took it upon himself to come up with such amazing Indicator in 1950.
This Indicator has been widely adopted by various traders and investors and it's helping them in the market to make good decision.
The use of this indicator is to keep track of the price with respect to it's momentum in a given time period. This is done by making a comparison of an asset closing price to the price range over a period of time.
Further more, stochastics Oscillator is used in predicting the reversal point of price which at the long run become of great help to the trader by providing him with the knowledge of an asset's possible support and resistance.
The operation of the indicator is within the range of 0 - 100, and as such makes the trader to easily detect an asset's over sold and over bought region. Thus, depending on the strategy that works for you as a trader, you can then set your over bought or over sold region.

Q(2) EXPLAIN AND DEFINE ALL THE COMPONENTS Of THE STOCHASTIC OSCILLATOR (% k line,% D line + OVERBOUGHT AND OVERSOLD LIMITS).

The Stochastic Oscillator comprises several Components which are basically lines and limits. These components are;
% K line;
The % k line is known as the stochastic indicator. It is the fast line that displays the real value of price momentum.
How to calculate it is by the finding the difference between the lowest price gotten over a given period from the past closed price. Then divide the outcome with the result you will get after you had found the difference of the highest high the price traded and the lowest high the price traded.
FORMULA
% K line =( RCP - LPT)/(HPT - LPT) × 100
Where;
% K stands for... "Stochastic line"
RCP ......... "Recent Close price"
LPT .........."Lowest Price Traded"
HTP ............. "Highest Traded Price"
%D line
This is another Component and second line in stochastic indicator. Very important in giving a dependable signal to the trader. It is derived from %k. This line is regarded as slow moving stochastic Oscillator since it is not as fast as the %K.
Traders will now attempt to take a most likely trade upon spotting the junction at where the two lines (%K and %D) meets.
As I mentioned above, the stochastic Oscillator functions within the range of from 0 - 100. Therefore, when stochastic line goes below 20, an asset is said to be over sold. This usually take place following a by gone long bearish move in such a way that the stochastic line would go down below 20 range.
OVERBOUGHT LIMIT
Over bought limit is the reverse, that is the opposite of the over sold. And this is seen when the stochastic Oscillator is within 80 - 100. An asset at this point is said to be overbought. So, when this scenario occurs, a trader should be anticipating a possible reversal of the bullish trend in the nearest future. It is very helpful in determining the market behavior at a particular point of time.

(3) BRIEFLY DESCRIBED ATLEAST TWO WAYS TO USE THE STOCHASTIC OSCILLATOR IN A TRADE.
Below are the various ways stochastic Oscillator is used....
TRADE SIGNAL
A trader with good experience is always at alert to know when the %K and %D will cross each other upward. This gives a signal that an asset is in the oversold region. A trader can get a good buy signal using this two lines, hence, he can decide whether to enter a trade or not. So that when he can anticipate a sell order when the asset finally enters the overbought region.
TO DETECT TREND REVERSAL
Stochastic Oscillator can also be used to detect a possible reversal of a trend.
The trend of an asset could either be upward or downward. After an asset has moved on a particular trend, then a trader can use it to predict when a trend is about to reverse. Example is when an asset in a bullish trend encounters where the stochastic lines enters an overbought bought region. Anticipate the reversal of the prevalent trend in no distant time.
SUPPORT AND RESISTANCE
Another important use of oscillator is that a trader can use it to know the zone of support and resistance. In addition, a trade gets an idea about the zone of demand and supply of an asset.

(4) DEFINE IN YOUR OWN WORDS, What IS PARABOLIC SAR?
This is another interesting indicator that is used in determining the market behavior by keeping track of the possible trend change of an asset and also the price direction. It was developed by J. Welles wilder.
Parabolic sar is also called Stop and Reverse [SAR] indicator. It helps to indicate at what point did price reversed, no wonder it is used to detect the direction of a price cum it's reversal. It can also be useful in making an entry cum exit point for a trader order.
Further more, the indicator is mostly very effective for a trending asset. SAR is a very powerful indicator that gives upto 70 - 80percent accuracy when a trader uses it in combination with other indicators.
Parabolic Sar is very unique indicator when compared to others such that it is displayed on the chart as a series of dots. The dots are always found in proximity to any chart pattern like bar, candle stick etc that a trader is making use of.
Then a lot of traders are now concerned to spot out a movement change of the dots so that they can now get ready for a possible order. Anytime the dots are seen below the current price, it is observed as a bullish signal. And it's considered as bearish signal in the other way round.
It is similar to moving averages but differs a bit in the sense that it moves faster than moving averages. You get the best result when you use this indicator in combination with other indicators, So, using only it is not recommendable.

(5) EXPLAIN IN DETAIL WHAT THE PRICE MUST DO FOR THE PARABOLIC SAR TO CHANGE FROM BULLISH TO BEARISH DIRECTION AND VICE VERSA.
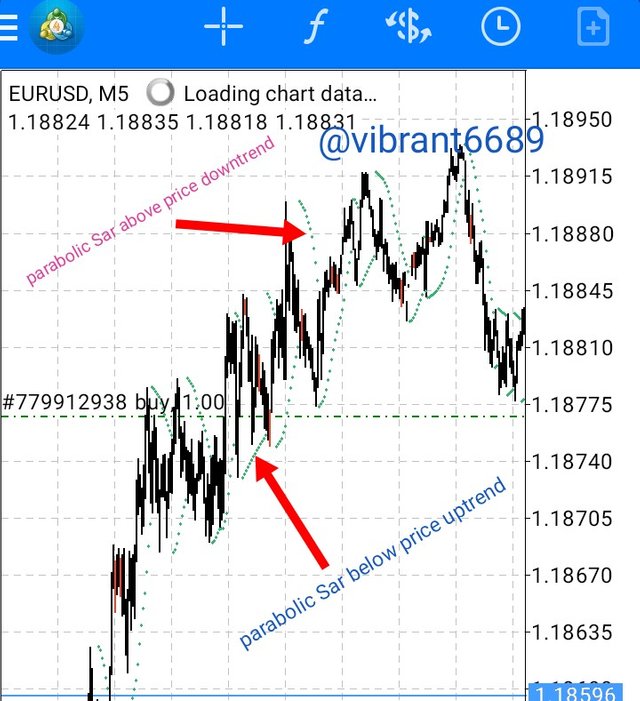
Talking about the bullish trend, you find the parabolic Sar as it is lying below the price of an asset.
The price will continue to move upward with the parabolic dots continuously lying below it. Then at the time the price touches the parabolic sar, it compares the parabolic sar to have a change in direction from bullish direction to bearish direction.
Then on the aspect of the bearish trend. It just the opposite on the bullish. In this case, you find the parabolic Sar above the price. The dots of the parabolic Sar will continue to be above as long as the bearish trend persist.
At the time the price touches the parabolic Sar upward down, it will effect a direction change of the parabolic Sar from bearish to bullish trend.
It helps in signifying when an ongoing trend is to make a reversal.

(6) BRIEFLY DESCRIBE AT LEAST TWO WAYS TO USE PARABOLIC SAR IN A TRADE?
Tracking Trend
Parabolic Sar indicator is one of the best indicators that can be used to track a trend.
Specifically, it is used to determine the market direction either bullish or bearish trend for a given period of time. It is regarded as bullish trend If the dots lines are placed below the price in the bearish trend it is regarded as bullish trend, while for a bearish trend you place the dots above the price.
ENTRY AND EXIT POINT
It is very important to note that is very possible for a trader to use this parabolic Sar in detecting his entry and exit point. Example, at a given point in time, the price will cross the dots from downward up, this will signal a trader to know that bullish move is about to make a reverse. On seeing this, a trader who had been on the bullish run recently will start to pull out his assets and exit the order. Here, You can also make a good of an entry for a sell order.

PRACTICAL
(1) SHOW A STEP BY STEP ON HOW TO ADD THE STOCHASTIC OSCILLATOR TO THE CHART (INDICATING THE %K LINE AND THE %D Line, THE OVERBOUGHT AND OVERSOLD ZONE.
For me to carry out this task,
- I will make use of the meta trader app in my phone.👇

_
• I will open it by clicking on it. The image below was what I saw as it opened👇
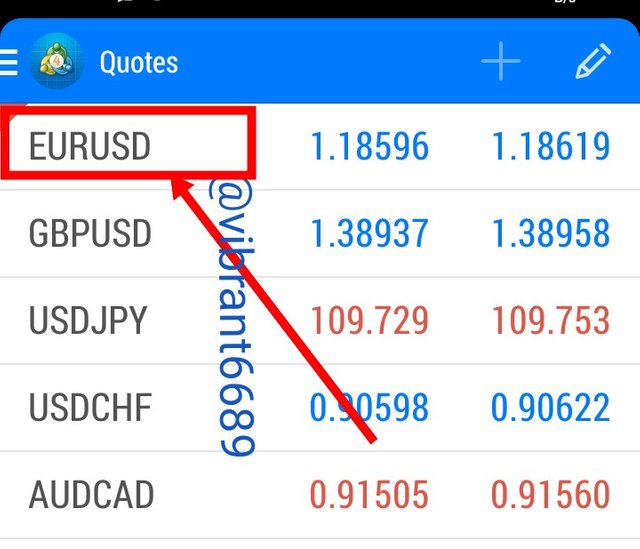
The image above displays list of currencies. I chose the EURUSD as the one I want to add oscillators.
_
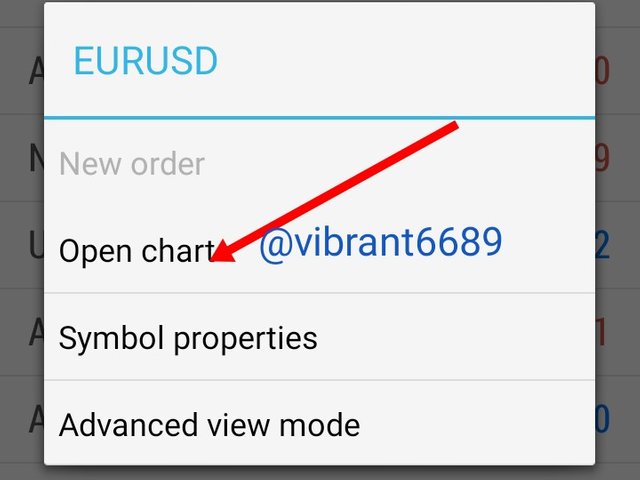
• when I clicked on the EURUSD, a page popped with options and I clicked on open chart👇
_
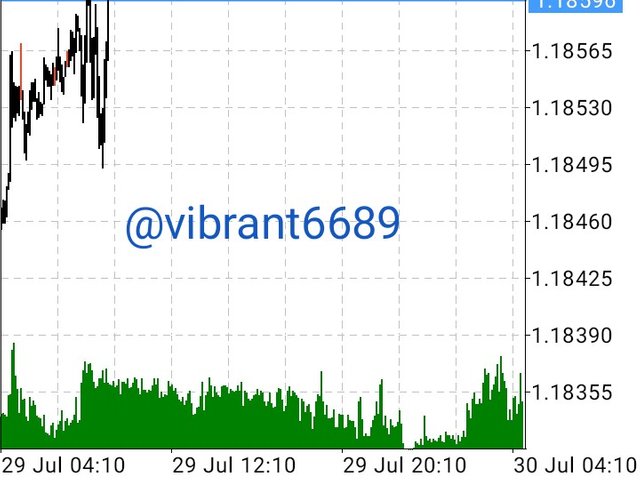
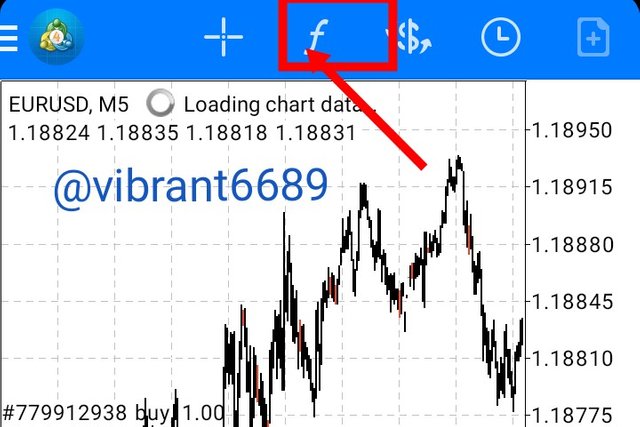
• As the chart was opened, I saw that the stochastic Oscillator was there in the chart. Therefore, for me to add it, I will click on the indicator icon (f) at the top👇
 |  |
|---|---|
| No stochastic oscillator added | Click on the indicator icon to add it |
_
- After I had clicked on the indicator icon, a page that contains different types of indicators appeared. Unlike trading view, I don't need to search but would just select the one I want which is stochastic oscillator 👇
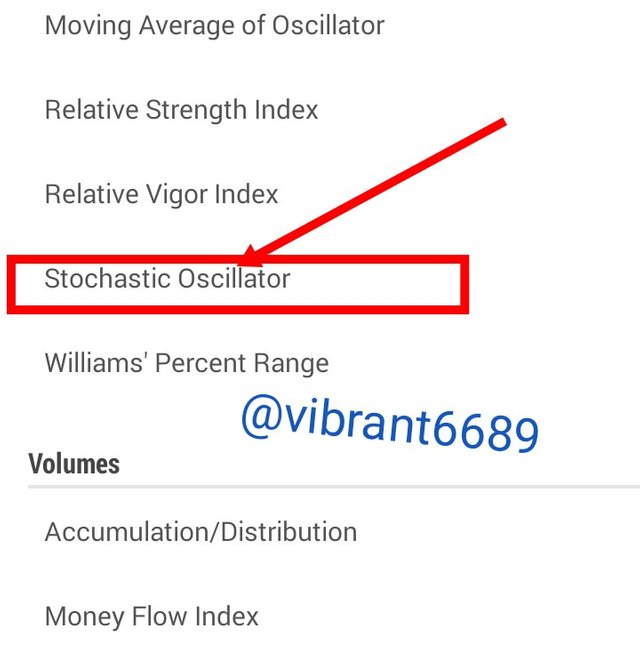
_
- After I had clicked on the stochastic Oscillator, a page appeared.
Its in this page that I can modify the oscillator to my taste. For example, the first two arrow markers shows that I added 5 period for %K and 20 period for %D, then used green color for %K and red color for %D👇
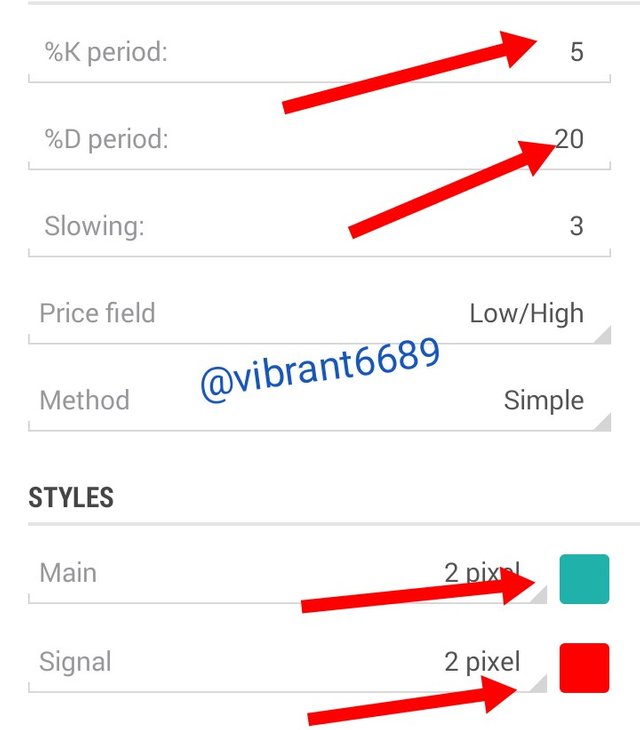
After adding the data as I desired, I clicked done at the top right hand side.
_
- Now I checked back in the chart and discovered that stochastic Oscillator have been added successfully.👇
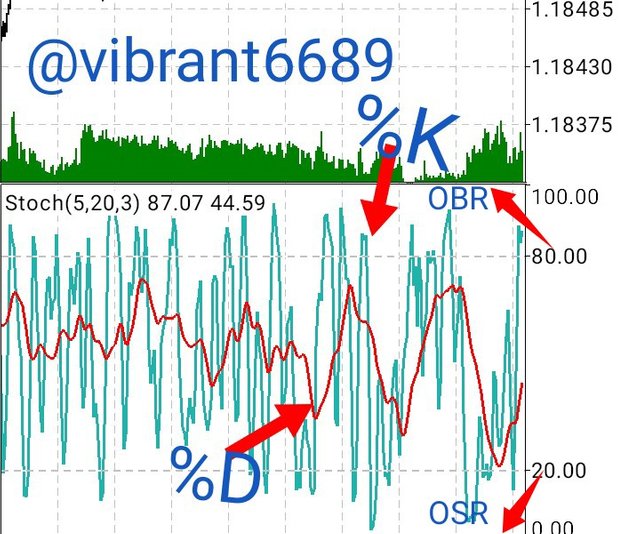
From above screenshot, you can notice that I used green color for %K and red for %D.
Then the over sold region as I noted as (OSR) is at the down side, from 20 and down below while the overbought region (OBR) is the upside, from 80 to 100.

(2) SHOW STEP BY STEP HOW TO ADD Parabolic SAR TO THE CHART AND HOW IT LOOKS IN AN UPTREND AND IN A DOWNTREND
For me to carry out this task, I will still follow thesame steps as above...
- click on the indicator icon 👇

_
• Page that containing different types of indicators will appear. Select parabolic Sar.👇
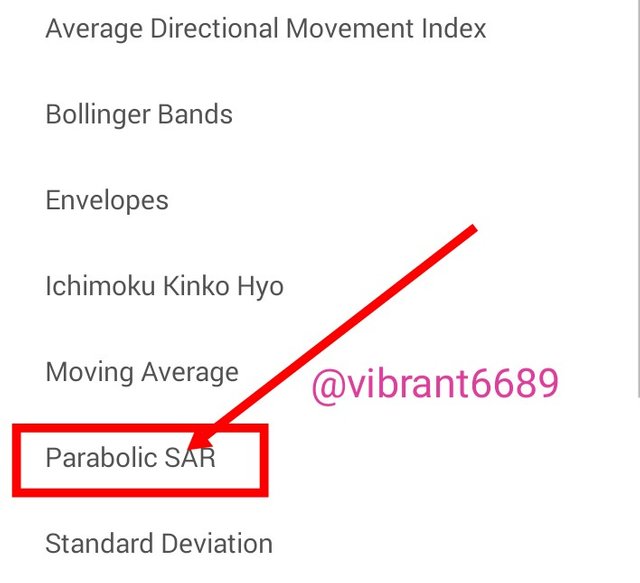
_
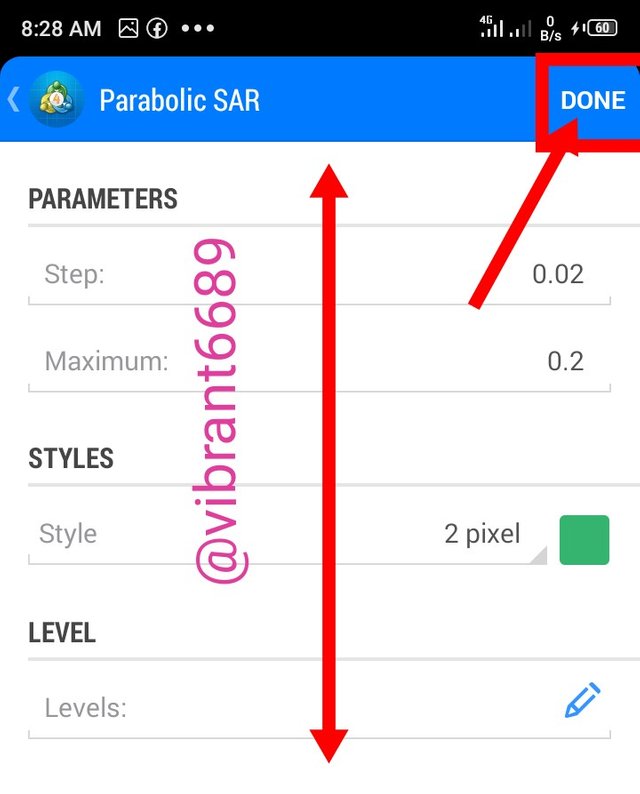
- Do your modifications in this page if any and click done.👇
_
• Check back to the chart. Parabolic Sar is added successfully.👇
_

(3) ADD THE TWO INDICATORS (STOCHASTIC OSCILLATOR + PARABOLIC SAR) AND SIMULATE A TRADE IN THE SAME TRADING VIEW, ON HOW A TRADE WOULD BE TAKEN
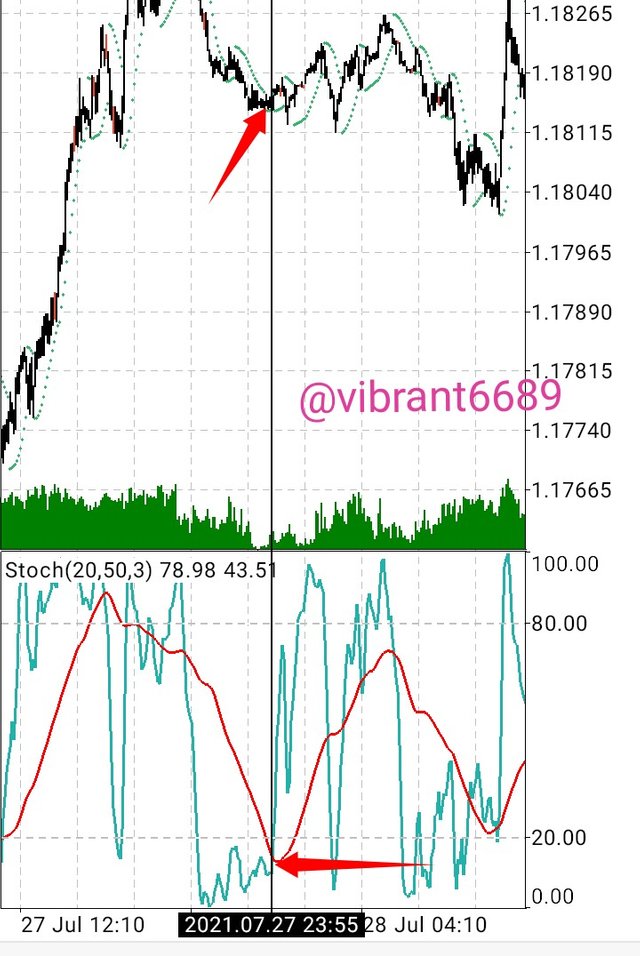
Why I did that trade simulation in the screenshot above is because...
The %K and %D lines crossed each other at the over soled region and that is a sinal of a trend reversal.
Then price that was moving below the parabolic Sar in an uptrend crossed over in the down which led to the two lines of oscillators to cross.
Direction of the polarabolic Sar changed from bearish to bullish. Thus, the trade order was simulated.

CONCLUSION
What experience I've gotten in this class and assignment, is the saying that, a tree can not make a forest. For instance, using one indicator will give you a result quite alright, but the combination of different indicators will give a better and excellent result.
Therefore, it is adviceble to combine two or more indicators, example, combining the stochastic Oscillator and parabolic Sar give more accurate results.
NOTE; ALL IMAGES EXCEPT MY COVER IMAGE ARE SCREENSHOTS FROM MY META TRADER 4 APP
THANK YOU
.png)
Regards to professor
@lenonmc21.
