
introduction
Hello Crypto academy this week we had a very interesting lesson by prof reminiscence01 about trends. How to spot reversals and continuation break in market structure, divergence amongst many others.
Below you would find the answers to the questions which were asked to show that I properly understood this lecture and went further to do my own research.
Pls enjoy

Question 1
Answer 1a
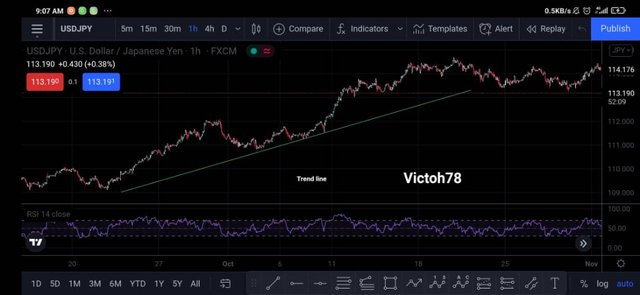
trendline || image gotten from trading view
Trend reversal
trend reversal as it relates to this lecture entails a situation whereby the price action changes direction to the opposite side.
This means the situation whereby a downward trend changes to an upward trend or an upward trend changes to a downward trend .
Trend reversal does not just mean when the price retraces a little it is a completely reversal of the previous price movements , trend reversal could be spotted on various time frames on the chart.
benefits of identifying trend reversal early
There are two main benefits of identifying a trend reversal early
• To prevent losses
• To make money
Prevent losses
What we mean by preventing losses is this, when a trend reversal is not identified early traders tend to enter the trade thinking it's just a retracement but the price keeps going in the opposite direction but because of it is difficult to admit when we are wrong they keep staying in such trade and keep opening more trades in hopes of the market finally responding in their direction. This would likely happen because when a trend reversal happens it changes to the opposite direction. Unlike a retracement where the price goes in the opposite direction for a bit and then resumes in the original direction. Without identifying a trend reversal early we stand at the risk of trading against the market this would result in loss of financial resources.
To make money
Catching the start of any trend is a dream come true for any trader this is because most trend last for days , weeks and even possibly months. It therefore means that a trader who entered the trade from the upset would have cut the market at the point where it has gone to its lowest or highest and from there it's only up.
Catching a trend from the upset allows trades the opportunity to make so much money as they can ride the trend for as long as they pleased and take profit whenever they feel like.
Answer 1b
how fake reversal signal can be avoided
Fake reversal trend can be avoided by various means such as watching out for break in candle stick pattern, break in Trend lines and various other ways
But since I would be talking about most of this below I would like to explain how we can use Fibonacci to filter out false reversal signals.
Using fibonacci to filter falser signals.
• identify your bottom (Start of trend)
• identify your top (heightest point of trend)
• after Identifying this two point join them with your Fibonacci line
• joining it will give you the various pivots (critical)points .16, .32, .50. 64
• there is a general rule that a reversal would likely not occur if the price doesn't get up to .50
• in the event that the price gets above .50 it indicates that there is a high chance that the trend would be reversed.
The above could be seen below
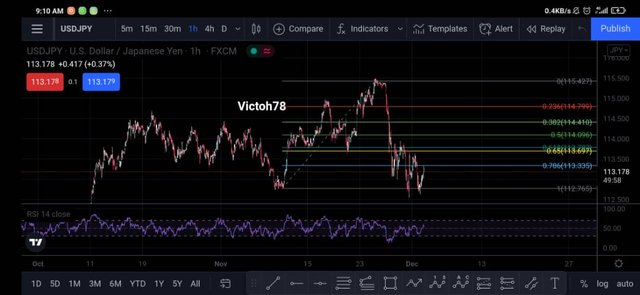
Trend reversal with Fibonacci||image gotten from trading view
From the chart above we can see that when the price crosses the .50 it went further to reversed from an upward trend to a down trend. Hence the principles hold that once the prices passes the .5 line on the Fibonacci the reversal looses very likely and hence helps prevent fake reversals.
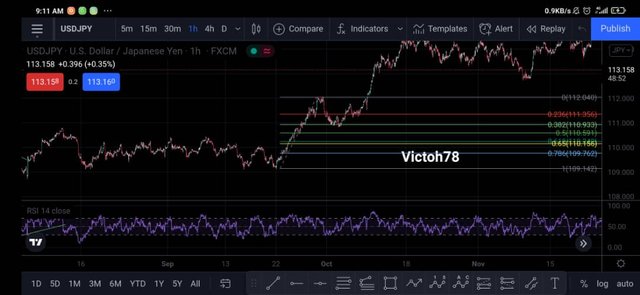
false trend reversal||image gotten from trading view
From the chat above we can see that the price failed to go below the .32 point and started going back. Hence the reversal couldn't take place and this was only but a retracement for further upward movement.
The points on the Fibonacci are very essential as they serve as key support and resistance point. In the above instance the .32 point served as a strong support which the price couldn't break which lead to the price going back up.

Question 2
Give a detailed explanation on the following Trend reversal identification and back up your explanation using the original chart. Do this for both bullish and bearish trends (Screenshots required).
a) Break of market structure.
b) Break of Trendline.
c) Divergence
d) Double top and Double bottom
Answer 2a
Break of structure
Market structure this is the the way in Which the price moves in relation to the market. structures are essential for chart anyalsis they tell us alot about how price moves it tells us that price moves in particular pattern.
Break in structure this occurs when there is a deviation from the flow of the trend pattern. A trend consist of a pattern which aare candle stick movements within a particular period of time. For the structure to break then the price must have deviated from the norm of the trend flow.
To further explain better we take the two types of trendSeparately
1 bullish trend
2 bearish trend
Bullish trend
This occurs when the price is going up it could be slowly or rapidly all that really matter are they the price is going up and following a given set of patterns this patterns are what indicate to us the streght of the trend and the weakness of the trend .
For a bullish trend (uptrend ) the price has to make consistent higher highs and and higher lows this indicates that the price is moving up and the pattern is unbroken.
A break of structure of a bullish trend is seen below
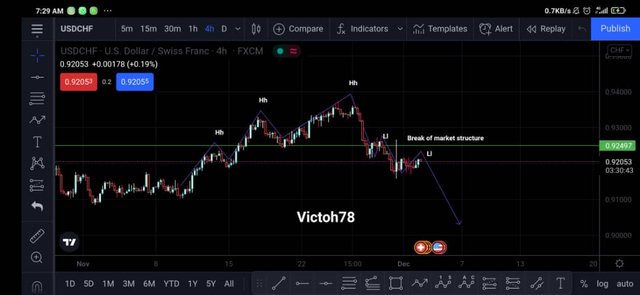
Break of structure bullish||image gotten from trading view
From the chart above we can observe that initially the price kept making higher highs and higher lows the uptrend was was intact and was looking solid up until the point where the bulls were exhausted and the bears took control of the market and took the price down. The break of structure occured at the point .924927 where the price failed to make a higher here but fell below the last higher low. From this point the price has Begun to make lower lows and lower highs.
From this chart above we can see that the break of structure for a bullish market occurs at the point where the price fails to make a new higher high and new higher lows and goes below the previous low forming lower Lows, at this point the the price starts forming lower lows and lower highs. Hence the structure has broken.
Break of structure : Bearish trend
This occurs when the price is on a downward slope. The price is consistently falling and creating new lower lows. This usually occurs when the sellers /bears are in control of the market .
A bearish trend follows the market structure such that it goes down progressively all the while retracing a bit up and going back down
A break or structure of a bearish market
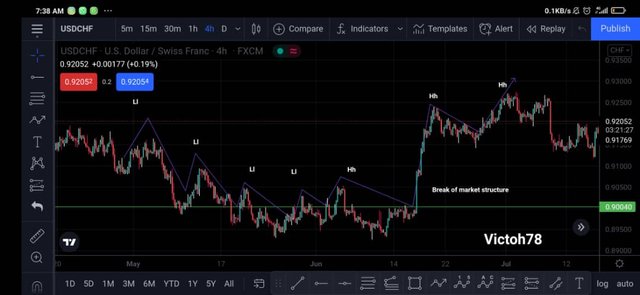
bearish break of pattern||image gotten from trading view
From the above we can seee a break in the bearish/selling price pattern. This break. In pattern as a result of the price inability to continuously create new lower lows and lower highs.
The area responsible for this break in pattern is .90040 it is observed that at this point in the chart, price failed to get lower than this point probably due to the fact that this is a critical point in the chart history. It is observed that after the 3rd lower lows as indicated by our chart the price fell into the support region of .90040
While it did break the structure at this point the 4th high was higher than the previous high and the down trend could still be argued to be in a down trend.
The trend was finally broken after the 4th high entirely shattered the two previous high by making a high, higher than previous high.
From this it could be said that the trend of a bearish structure would only be broken when the new highs are higher than previous highs as seen tin the graphs above.
Answer 2b
Break in trend lines
Trend lines as indicated above can be said to lines which are drawn in the chart which indicates the direction of the price . Trend lines are essentials in the chart analysis and helps to easily identify the direction of the trend. With the aid of trend lines we can't easily identify the direction of the trend .
bullish trend line break
Trendline being an indication of the direction of the price movements often serves as an guide which helps to tell us when the price could possibly reverse in the case of a bullish trend line reversal this is a situation where by the upward trend is reserved.
This can be showed below as..
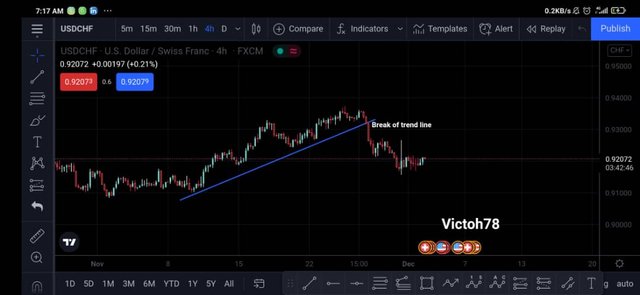
Bullish trend line||image gotten from trading view
From the above chart we can better explain the break of trend line as follows , we noticed from our chart that during an upward trend the price is usually above the trendline indicating that at the price is going up .Occasionally the price would go down but never below the trendline, this indicates that the trend line is strong and it serves as a sort of support for the price at this point when price gets here it usually bounces back up, this can be seen from that chart above. But as we all know that all trends must come a conclusion at some point and eventually the trend would be broken. The trendline helps us to understand when the trend would reverse.
When the price breaks below the trendline like seen above it indicates to us that the trend is has come to an end and we need to start switching from a buy to a sell in the market we are trading.
The trend line is very efficient a this, the price would continue going up as far as it is above the trendline. As soon as the price breaks below the trendline it means that the trend has changed direction and it is now a bearish.
break in bearish trendline
The bearish trendline indicates that the price is in a downward trend and that the sellers are in control. In the case of the break in bearish trendline the price would have to break above the trendline indicating that the price direction has changed from a downward trend to an upward trend .
This can be seen below
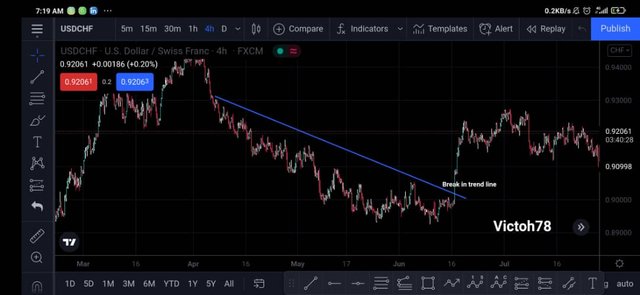
bearish trend line||image gotten from trading view
From the above we can see that the price is below the trend line. Which indicates that the direction of the trend is in a downward.
The price seen above can be seen to be respecting the direction of the trend line . On various occasions the piece came up to the trendline but wasn't able to get above the trendline serves as a sort of resistance which enabled the price to continue the downward
Trend.
The break of trendline occured at the point where the price broke above the trendline, this break indicates that the trend has changed from a down trend to an up trend.
Answer 2c
Divergence
This occurs when there is a disparity between the price shown on the candle stick pattern and the indicator. Divergence is mostly seen when we combine the rsi and the price action
Divergence are a strong indicator of trend reversal this is so because in as much as the price is moving in a direction the indicator is warning ahead of time that the trend is slowing down and in the short future it it would change direction to the opposite side. They exist two types of divergence there is the bullish divergence and the bearish divergence.
bullish divergence
This occurs during a. Bullish trend where by the trend price is going up but the RSI Is indicating that the price is about to drop in the near future the Divergence can be seen on many time frames wether the 15mins, 30 mins, 1hr and so on. The bullish divergence gives an early warning of price changes.
Below is an example
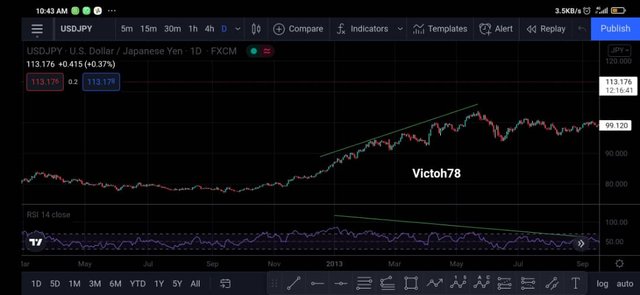
Divergence bullish||image gotten from trading view
From the above we can see that while the price was trending upward the RSI Was trending downward indicating that the upward trend was weak and would soon change to a downtrend and eventually the trend did change to a downward trend.
Hence the bullish divergence s very good to indicator of the weakness of a bullish trend and it indicates that we should be closing our open buy positions and switching to a sell positions.
Bearish divergence
The Bearish divergence, this occurs when the price is going downward but the indicator such as RSI are going in an opposite direction, this indicates that the bearish trend is weak and would change
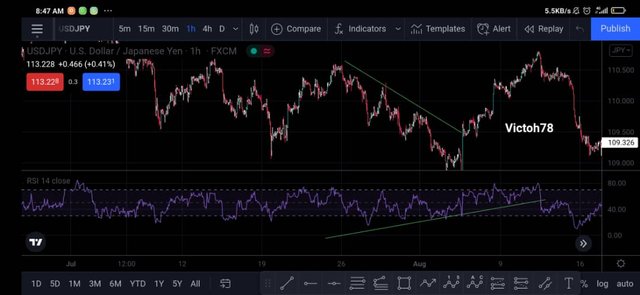
Divergence bearish reversal||image gotten from trading view
From the above we can see that though the trend was on a down trend the RSI which normally follows the trend was on an uptrend the reverse.
This indicated that the trend was weak and it would reverse very soon and true to it , the trend reversed to an uptrend in the near futures .
Hence the bearish divergence is an indicator that shows that the though the price is going downward the price is about to up change direction upward.
Answer 2d
double top
The double top pattern is a bullish reversal patterns that occurs when the price is unable to make a new high after revisiting the previously high a second times. After the first visit the price drops a bit and comes back to test the point. This second test once rejected indicates that the resistance above is very strong and the uptrend is over.
The resistance being very strong gives the price no other alternative than to fall. The double top is not difficult to spot in the chart and can be seen Below
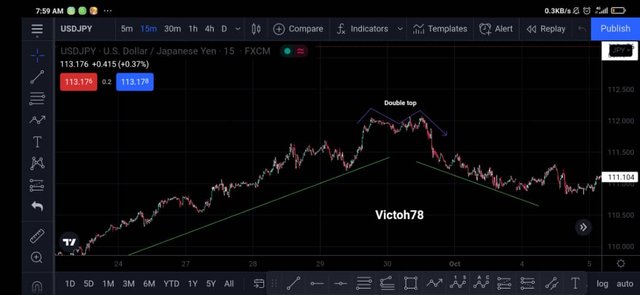
double top||image gotten from trading view
from the above we see that the price after making a new high failed to keep the momentum going and went down a bit.
This down movement wasn't so huge that it would pass the .32 point on the Fibonacci point . So we had no reason to suspect the uptrend could be end
It was only after the second test where we saw the price get rejected again at the previous high that we then see clear indications that the price trend had changed to a downward trend so basically when the price is unable to make new highs at a particular location, the double top could be formed in such areas indicating trend reversal
Double bottom
Double bottom is a bearish trend reversal it indicates that the bearish trend has come to an end and that there is a bullish trend starting the double bottom occurs when the price is unable to makes new lows.
The price is steady making new lows up until a point where the price reaches and faces support hence the price bounces up, this bounce up is only momentarily and soon again the price comes to test the previous support (last lows) this time again the price is rejected.
When such happens it is seen as a double bottom and is a bearish trend reversal signal.
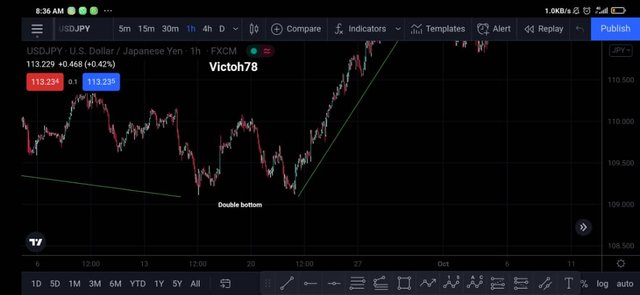
double bottom||image gotten from trading view
Question 3
Answer
Having been thoroughly taught all the various trend reversal patterns, it now becomes compulsory to Futher show prove of my of understanding.
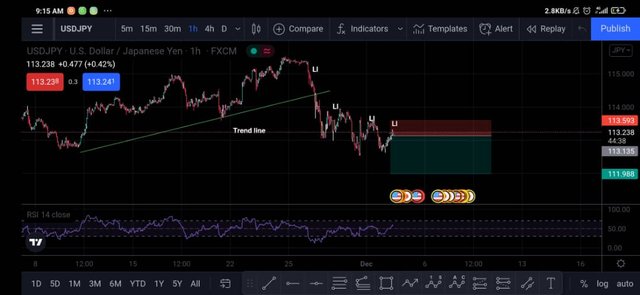
trade analysis of usdjpy||image gotten from trading view
From the above chart above we can see that usdjpy had been on a steady uptrend respecting the ascending trendline and making higher highs and lower Lows as indicated above. Eventually the trendline was broken and the trend has been switched to a down trend. The trend changed due to the fact that the support was weak and the price was stronger. We can now see that the price now keeps making lower lows and lower highs this indicates that the trend have changed .
In other for us to enter this trade we would be looking to short the market(sell) Since we have our confirmation that this a bearish market we don't want to be buying on a bearish market .
To trade this we patiently wait for the price to retrace back up and we sell so that way we catch the downward trend from the top. We don't want to be selling at the point where the price is over sold.
By waiting for the price to retrace we can limit our risk and can catch the trend from its onsets our stop loss is placed at the top of the previous low this is to insure that if our anyalsis is wrong we are not going to keep loosing money we would get stopped out. After all it is still an anyalsis.
Next we set our take profit at a 1:2.5 risk to rewards this so to say that if we are willing to Risk $100we are going to get $250 when the trade goes through.

Conclusion
Above I have answered all the questions that were put forward towards me. I did this to the best of my ability I know you would find my answers to the questions up to standard.
I would like to thank the entire teem of crypto academy for organising such a conductive environment for learning and even more so to my prof reminiscence01 whose lecture spurred me to carry out even Futher research and enabled by better understanding of the topic.
Note : that all the charts are my anyalsis of two currency pairs USD/JPY and USD/CHF using trading view
Excellent post, very detailed and well explained through your good analysis. Thanks for sharing. I wish you a nice day.🙏🌻💕
Downvoting a post can decrease pending rewards and make it less visible. Common reasons:
Submit
Hello @victoh78 , I’m glad you participated in the 3rd week Season 5 of the Beginner’s class at the Steemit Crypto Academy. Your grades in this task are as follows:
Observations:
You have failed to adhere to the homework task by using a non crypto chart for your analysis. This is crypto Academy and you are required to relate your studies to the crypto market.
Downvoting a post can decrease pending rewards and make it less visible. Common reasons:
Submit