Hello to everyone!
Thanks to Professor @stream4u for his wonderful and very detailed lecture #2 in the framework of the amazing crypto-academy project, which you can read here: https://steemit.com/hive-108451/@stream4u/steemit-crypto-academy-or-course-2-by-stream4u-or-how-to-read-candlestick-charts-in-different-time-frame-and-information-about buy-sell
When I read this lecture, I immediately realized that I had made mistakes in my cryptocurrency trading. And how good it is that there is a professor who can explain in the simplest and most accessible language at first glance simple, but in fact, when it comes to the issue of crypto trading, very difficult moments. And they need to be known to every participant of the crypto market in order to place orders on crypto exchanges very carefully and correctly.
So, what became clear to me from the lecture. The first step is to decide what type of trader I am? I think that I am a short-distance trader, and also for the major crypto assets BTC and ETH, I am a long-distance investor.
Given this point, it became clear to me that for trading for a short period of time, it is easier to say, buy-sell, I should use charts of 5m, 15m, 45m and preferably view them simultaneously to see the overall picture of the market for a particular crypto coin where the price moves, or it rises or goes down.
An important point is to choose the right trading schedule, depending on the goals of your trading-long-term investment or day-week trading.
I honestly admit that I did not make distinctions in this matter and often looked at all the charts, so for me this point is now clear and clear.
I will now review three charts for the USD/ADA coin on the 5m 15m 30m chart right before writing this post on 17.02.21
So my task is to find the right entry point and place an order to buy ADA for a dollar $
I take my time and can observe the coin and its movement for 2-3 days. I certainly want to buy cheaper and sell more expensive. Based on the above charts, I conclude that it is better to place an order tomorrow, because I have some doubts. See for yourself:
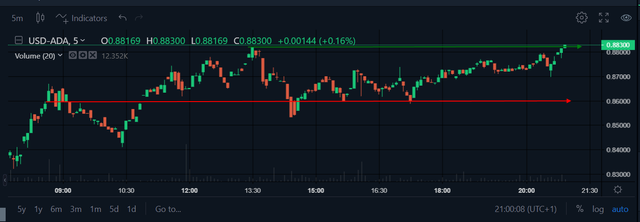
Here on the 5m chart I see the support zone, I marked it with a red line, according to which it is correct to place a buy order at about $ 0.86 per coin and sell at $ 0.88700, where the resistance line passes, it is highlighted in green.
This can be done by crypto traders who trade with a margin, for them they bought and sold instantly. I do not belong to this type of trader... while.

Then we look at and analyze the chart for 15m. And we see that here you can already place a buy order not at the price of $ 0.86, but below, at about $0.85800, and the resistance line was broken and the price went higher than on the 5m chart. So there is definitely no point in selling the coin if it has already been purchased from you.
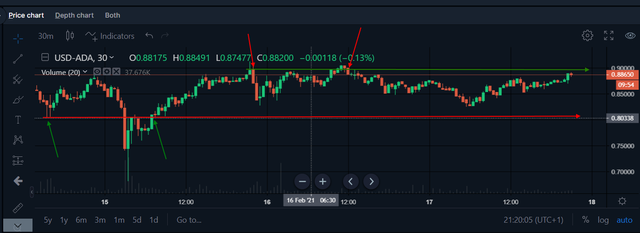
And on the 30m chart, we see a picture of today's trading and we see that the ADA crypto coin has a chance to go to the support line, which is located at $ 0.80, it is highlighted in red, and the resistance zone is green and is located at almost $ 0.90. The red arrows marked the points entry - purchase, and the green ones marked the points exit-sale.
So I conclude, why should I rush to make an order today? I'll wait 1-2 days. Why? Because you can see that on the last chart of 30m, the price of the coin dropped even below the support level of $ 0.80 and reached the level of almost $ 0.68. If once again in the near future the price drops to the level of 0.68$, it is quite possible that a new support line will form there and then you can safely place an order to buy ADA and completely sell it at the level of the resistance line, approximately 0.88$-0.90$. And then we will be able to make a profit of $ 0.22 for each ADA coin.
On the advice of our esteemed professor @stream4u, we must have patience and observe to correctly find the entry point to the market and earn as much as possible. And I totally agree with him. I hope you do too.
And two more important charts for me personally, because I would like to invest longtime ETH. And for the analysis for investing for the long term, I have to consider charts with a time mode-day and week.
And they also turned out to be different, and as you may have guessed, a more detailed and informative schedule is a week.
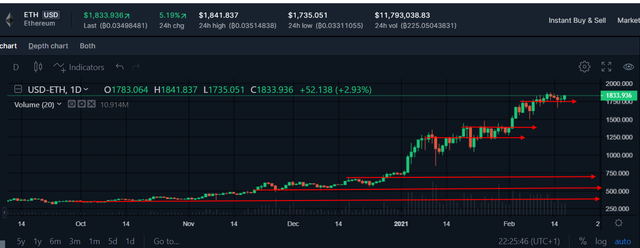
On two charts, I drew support lines with a red line, there are quite a lot of them in Ethereum, which of course pleases me as an investor. I will hope to buy back ETH at low prices, as happened in February 2020, when the price fell to the level of $ 109. On that day of the "sales", I bought XRP, in my opinion at $ 0.11 per coin, and I had to buy ETH and keep it, not sell it, but rather accumulate it.
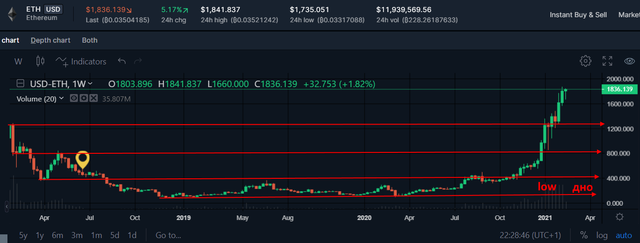
On the weekly chart, the support lines are more beautiful. And that's where I wrote low, that's where the bottom is, and when, I hope, we will once again have the opportunity to observe the fall, we will certainly know that at this point, at the level of $ 100-120, we need to stock up on etherium as much as possible, and not think that the end of the crypto economy has come.
I hope I did my homework correctly. If you have any comments, I will even be happy if the professor corrects me.
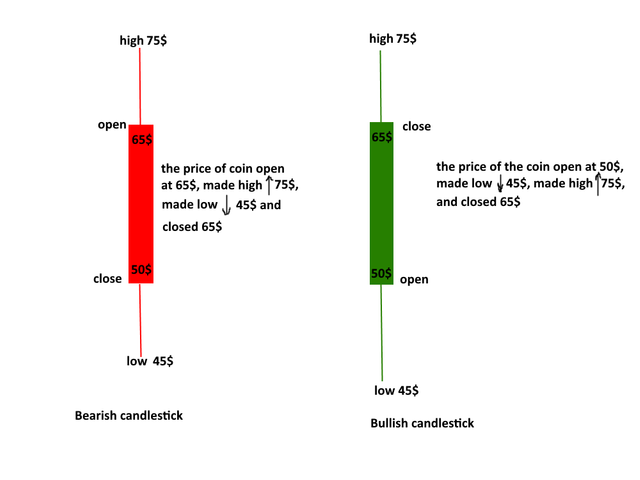
In the last photo (I myself drew candles red and green) and showed how to read them correctly
Thank you @steemitblog @steemcurator01 @steemcurator02 for the most beautiful, informative, necessary and interesting project on Steemit-crypto-academy and for your support of our publications.
Russian text.
Огромная благодарность профессору @stream4u за его замечательную и очень подробную лекцию №2 в рамках потрясающего проекта crypto-academy, которую вы можете прочитать здесь: https://steemit.com/hive-108451/@stream4u/steemit-crypto-academy-or-course-2-by-stream4u-or-how-to-read-candlestick-charts-in-different-time-frame-and-information-about buy-sell
Я когда прочитала эту лекцию, то сразу поняла, что у меня были сделаны ошибки в моей торговле криптовалютой. И как же хорошо, что есть профессор, который может самым простым и доступным языком объяснить на первый взгляд простые , а на самом деле, когда касается вопрос торговли криптой, очень непростые моменты. И их необходимо знать каждому участнику крипторынка, чтобы очень внимательно и правильно выставлять ордера на критобиржах.
Итак, что стало мне понятно из лекции. Первым делом необходимо определиться к какому типу трейдера я отношусь? Я думаю, что я трейдер на короткие дистанции, а также по основным криптоактивам BTC и ETH я инвестор на длинные дистанции.
Учитывая этот момент, мне стало понятно, что для торговли на короткий период времени, проще сказать, купил-продал, я должна использовать графики 5m, 15m, 45m и желательно просматривать их одновременно, чтобы видеть общую картину рынка по той или иной криптомонете куда двигается цена, либо она поднимается, либо идет вниз.
Важный момент - выбрать правильно график торгов, в зависимости от целей ваших торгов -инвестиции на дальнюю перспективу или торговля день-неделя.
Честно признаюсь, что я не делала разграничений в этом вопросе и часто смотрела все графики, поэтому для меня этот момент теперь является понятным и четким.
Сейчас я рассмотрю три графика для монеты USD/ADA на графике 5m 15m 30m прямо перед написанием этого поста 17.02.21
Значит моя задача найти правильную точку входа и выставить ордер на покупку ADA за доллар $
Я не тороплюсь и могу понаблюдать за монетой и ее движением втечением 2-3 дней. Мне конечно же хочется купить дешевле и продать подороже. На основании приведенных графиков я делаю вывод, что лучше я выставлю ордер завтра, потому что у меня появилось некоторое сомнение. Смотрите сами:

Вот на графике 5m я вижу зону поддержки, я ее отметила красной линией, согласно которой правильно выставить ордер на покупку по цене примерно 0.86$ за монету и продать по 0.88700$, где проходит линия сопротивления, она выделена зеленым цветом.
Это могут делать криптотрейдеры, кто торгует с маржой, для них купил-продал моментально. Я к этому типу трейдеров не отношусь... пока.

Дальше смотрим и анализируем график на 15m. И видим, что здесь уже можно поставить ордер на покупку не по цене 0.86$, а ниже, примерно по 0.85800$, и линия сопротивления была пробита и цена уходила выше, чем на 5m графике. Значит здесь точно нет смысла продавать монету, если она уже была у вас куплена.

А на графике 30m нам представлена картина торгов сегодняшнего дня и мы видим, что у криптомонеты ADA есть вероятность сходить к линии поддержки, которая располагается на отметке 0.80$, она подчеркнута красным, а зона сопротивления зеленым цветом и расположена на уровне почти 0.90$. Красными стрелками я отметила точки входа - покупки, а зеленым точки выхода-продажи.
Таким образом, я делаю вывод, зачем мне торопиться делать сегодня ордер? Я подожду 1-2 дня. Почему? Потому что вы видите, что на последнем графике 30m цена на монету опускалась даже ниже уровня поддержки в 0.80$ и дошла до уровня почти 0.68$. Если еще раз в ближайшее время цена опустится до уровня 0.68$, то вполне возможно, что там образуется новая линия поддержки и тогда можно будет смело поставить ордер на покупку ADA и вполне продать ее на уровне линии сопротивления, примерно 0.88$-0.90$. И тогда нам удастся извлечь прибыль 0.22$ за каждую монету ADA.
По совету нашего уважаемого профессора @stream4u, мы должны обладать терпением и наблюдать, чтобы правильно найти точку входа на рынок и заработать как можно больше. И я с ним целиком и полностью согласна. Надеюсь и вы тоже.
И еще два важных графика для меня лично, потому что я хотела бы инвестировать вдолгую ETH. И для анализа для инвестирования на длительный срок, я должна рассмотреть графики с временным режимом-день и неделя.
И они тоже оказались разными и как вы уже догадались, более подробным и информативным является график - неделя.

На двух графиках красной линией я начертила линии поддержки, их достаточно много у Ethereum, что меня конечно радует, как инвестора. Я буду надеяться откупить ETH по низким ценам, как это случилось в феврале 2020, когда цена упала до уровня 109$. В тот день "распродаж" я купила XRP, по-моему по 0.11$ за монету, а надо было купить ETH и держать, не продавать, а наоборот накапливать.

На недельном графике линии поддержки более красивые и конкретные. И вот там, где я написала low, вот там дно и когда, надеюсь, что нам еще раз представится возможность наблюдать падение, то мы уж точно будем знать, что именно в этой точке, на уровне 100-120$ надо запасаться этериумом как можно больше, а не думать, что пришел конец криптоэкономике.
Надеюсь, что я правильно выполнила домашнее задание. Если есть замечания, то буду даже рада, если профессор меня поправит.
На последнем фото (я сама начертила свечи красные и зеленые) и показала как их надо правильно читать.

Благодарю @steemitblog @steemcurator01 @steemcurator02 за прекраснейший, познавательный, необходимый и интересный проект на Steemit - crypto-academy и за вашу поддержку наших публикаций.
This IS very good stuff, It cleared some doubts i had thanks
#onepercent #venezuela #affable
Downvoting a post can decrease pending rewards and make it less visible. Common reasons:
Submit
Thanks, i am glad.
Downvoting a post can decrease pending rewards and make it less visible. Common reasons:
Submit
my post on Twitter:
Downvoting a post can decrease pending rewards and make it less visible. Common reasons:
Submit
Thank you for your post
Downvoting a post can decrease pending rewards and make it less visible. Common reasons:
Submit
Thanks to you.
Downvoting a post can decrease pending rewards and make it less visible. Common reasons:
Submit
Hi @vipnata,
You made a good post on Homework task 2, explained it very well.
Thank You For Showing Your Intrest in Steemit Crypto Academy
You have completed the homework task and made a good post, explained very nicely about How To Read Candlestick Charts In Different Time Frame & Information about Buy-Sell(Support & Resistance).
Remark: Homework Task Completed.
Thank You.
@stream4u
Crypto Professors : Steemit Crypto Academy
Downvoting a post can decrease pending rewards and make it less visible. Common reasons:
Submit
Thank you so much, professor @stream4u
Downvoting a post can decrease pending rewards and make it less visible. Common reasons:
Submit
This is a nice read @vipnata. You explained the candle sticks excellently. Thanks for this wonderful explanation. I should make mine too. I hope I'm able to analyse as you did. Nice work
Downvoting a post can decrease pending rewards and make it less visible. Common reasons:
Submit
@ckole, thank you for your kind words. I am very glad that you liked my post. I tried to explain everything in simple words, so that it was clear to everyone.
Downvoting a post can decrease pending rewards and make it less visible. Common reasons:
Submit
Yea, you did. I learned from it. Keep it up . Thank you. One love
Downvoting a post can decrease pending rewards and make it less visible. Common reasons:
Submit
Thanks for your opinions. I am glad.
Downvoting a post can decrease pending rewards and make it less visible. Common reasons:
Submit