Hello Everyone,
We into the season 2 final days now, Today I've chose to do the home work of crypto professor @kouba01. He has given us a comprehensive tutorial about Bollinger Bands trading strategy. Thank you for sharing your knowledge with us.

Introduction to Bollinger Bands Trading Strategy

Bollinger Band Indicators were created by John Bollinger in the early 1980s. Since then it was one of the highly graded technical analysis tool in the trading community. The Bollinger Bands Indicator shows the volatility of the market with three lines / bands in a trading chart. These bands have a centerline with a Simple Moving Average (SMA) set by user, usually 20days, and an upper band and a lower band. All 3 lines are the one we simply call as Bollinger bands.
It can help traders to take systematic trading decision by recognizing the pattern of the market, also it used in most time frames, from very short-term periods such as 15 min, to hourly, daily, weekly or monthly. The upper & lower levels can act as Resistance and Support levels as well.
👉 Calculation method
First, we have to calculate the Moving Average (MA)
If any one wonder what is Moving Average (MA) is, MA is the average price over a certain period of time. According to the price changes in the particular period, moving average can increase or decrease. So the calculation would be,
Moving Average = Sum of prices over x days/number of days
Ex: Last 5 days closing price for Polkadot
20.45, 23.30, 22.83, 25.92, 25.97 = 118.47
5 days moving average = 118.47 / 5 = 23.69
Now, I told that in introduction, Bollinger Bands centerline uses Simple Moving Average (SMA), by simple it means that when the time period moves, it drops the last data point and add the new data point. By default parameters moving average takes 20 days for the calculation, however user can change this setting to 10 or 50 days as well.
Once the MA calculated, other two band will calculated using the market volatility (standard deviation).
- The upper band is calculated by taking the centerline and adding twice the standard deviation.
Ex: Setting for centerline MA is 20 days
The upper band = MA + ( 20days standard deviation x 2)
- The lower band is calculated by taking the centerline and minus twice the standard deviation.
Ex: Setting for centerline MA is 20 days
The upper band = MA - ( 20days standard deviation x 2)
Once again for the standard deviation also two standard deviations are default parameters. This also can be changed with the time frame we set for the centerline. If we change 20 period into 10 then the standard deviation should changed to 1.5 and if we change centerline to 50 period then the standard deviation should changed to 2.5.
We are using different standard deviations because it will determine how much wider the band lines would be. When the number is greater, it would be less probable that market would touch the line. For example, if the standard deviation sets to 3 market will rarely touch the bands. In that case there is no much sense the set standard deviation more that 2.5
That is the calculation method Bollinger Bands
👉 How does it work?
Now that we know its a strategy with 03 moving lines, let's see what are the indication of those.
This is how it look like,
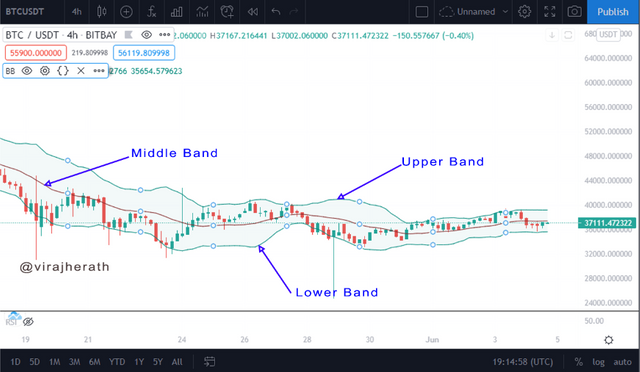
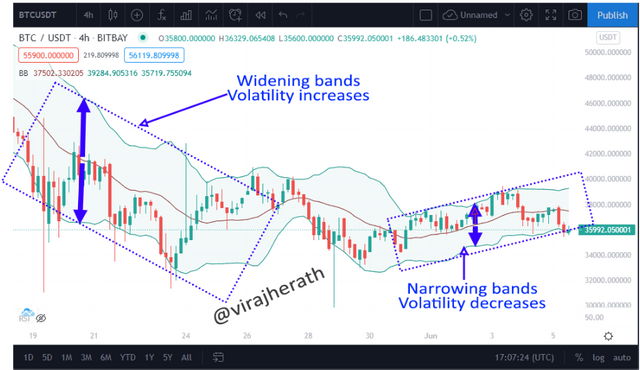
In the chart with the price volatility we can see these lines narrowing and widening its gap with the centerline.
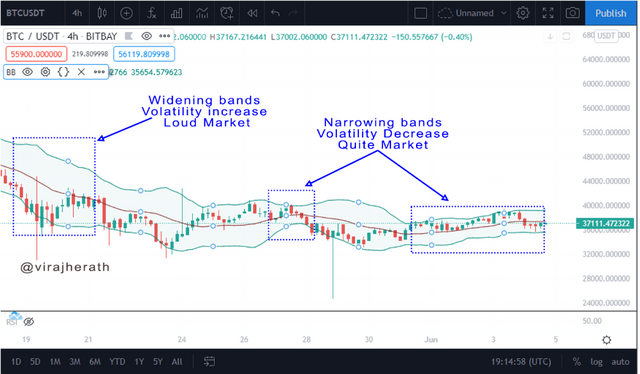
such movements indicates the Estimation of market volatility. When the market is narrow (less distance in the lines) we can see that the market is calm, hence the volatility is stable. Vise versa, when we see the wider gap between lines, we can see that market is loud and there's high volatility in the market.
👉 What is the best Bollinger Band setup?
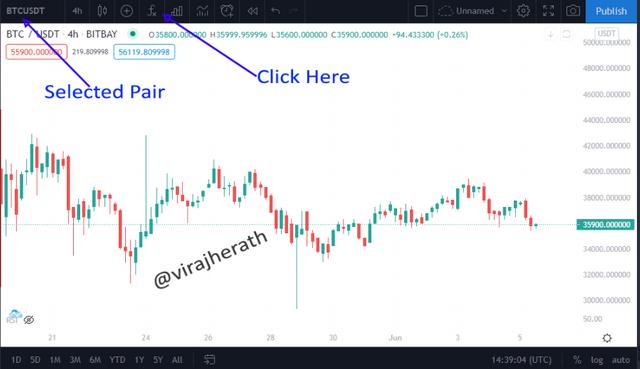
According to the trader strategy setup could change time to time. But there are proven strategies in the market with high success rate. I'm goin to take such as an example. As a research platform for my trading I use tradingview.com
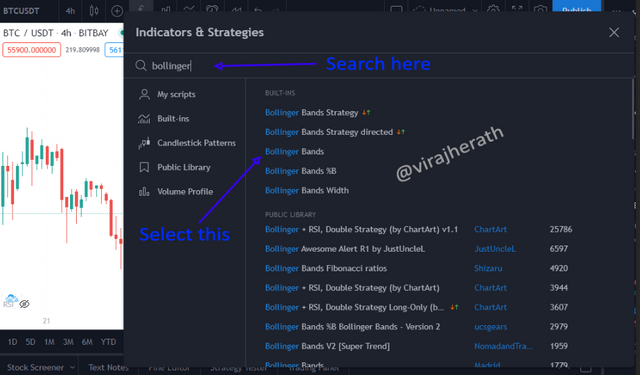
- Select the pair of coins in the search bar, I've chose BTC/USDT pair for this example. Then the trading charts will appear. Here in the top bar you can see the "Indicators & Strategies" with the ƒx sign, select that.
- In the search bar type "Bollinger" and you can see list of different indicators. Choose the "Bollinger Bands"
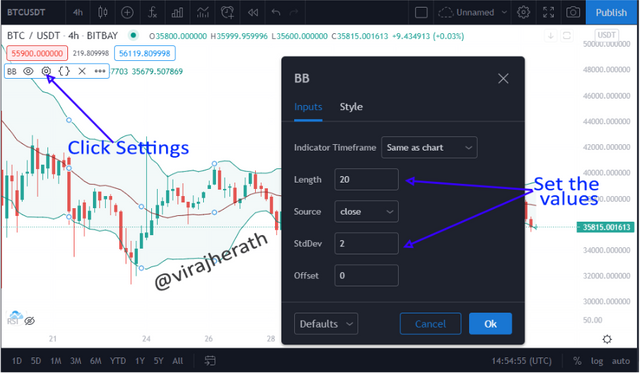
- Here you can change the setting, by default it will set Length = 20 & StdDev = 2 this is exactly what we also need as the best setup.
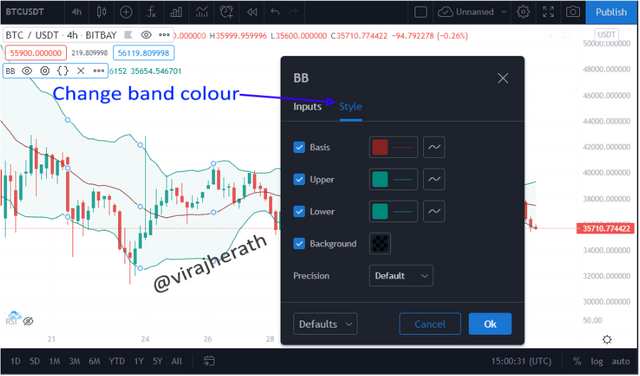
- By clicking "Style" you can change the colors of your band.
That's the way to set up the Bollinger Band in tradingview.
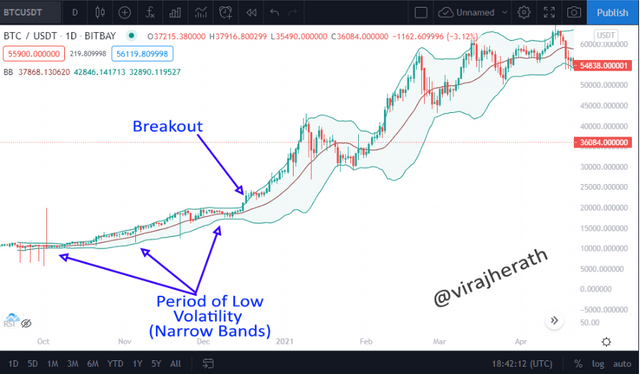
What is a breakout and how do you determine it?
Market volatility determines the bands width, I've already explained that when the market is quite low in volatility, bands range gets squeezy. When the volatility is high the bands get widen.
The breakout, from the name itself we can get a little clue about it. When there's a quite market Bollinger Bands consolidate through the period and squeeze the gap more and more, then the candles are closes below or upper bands and that is the scenario we refer as a breakout. It usually signals out buy and sell decisions to traders.
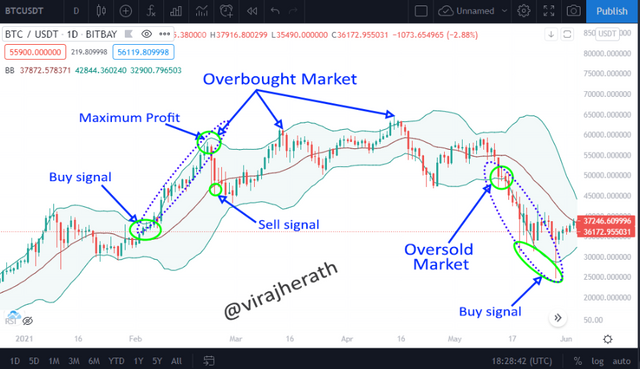
- Buy signal
When the Bollinger Band Breakout through resistance level and price closed above upper Bollinger Band traders refer this as Buy signal.
- Sell signal
When the Bollinger Band Breakout through support level and price closed below lower Bollinger Band traders refer this as Sell signal.
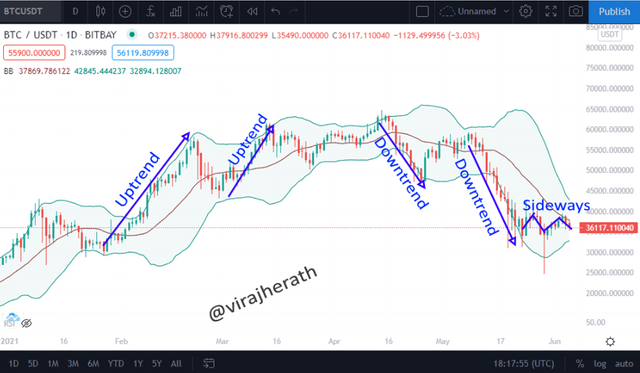
How to use Bollinger bands with a trending market?
There can be three types of market trends,
- Uptrend - call Bullish market.
- Downtrend - call Bearish market.
- Sideways Trend - call ranging market.
According to the demand and supply these market can range time to time. When we see a candle stick chart in any time frame we can find these trends.
- Using the Bollinger Bands in a Uptrend market,
Using Bollinger Bands trader can assume whether the market is strong enough to keep the trend. If the candles can continuously reach the upper band and stays above the centerline all the time traders can make their buying decisions in those momentum. If the candle pull back and then reverse to higher highs with even stepping outer the Bollinger Bands we call this Overbought situation. However, if the candle closes below centerline and touches lower band then their is a high probability to reverse the trend.
Most prolific traders take correct decisions to maximize their profit in such scenarios before the reversal occurs.
- Using the Bollinger Bands in a Downtrend market,
Similar to the previous scenario, in downtrend if the candles are continually reach to lower band and cannot pull back to the centerline such markets can describe as a Downtrend market. This indicates the selling pressure from the traders, and if the candles closes below the lower band we can refer such scenario as a Oversold
Many traders prefer to stay away from the market when there is a downtrend. However, some traders can see oversold momentums as a opportunity to buy signals in case of a trend reversal in long run. Because they can maximize the profit gain because when there is a selling pressure high and market is on a downtrend the price should decrease drastically.
What is the best indicator to use with Bollinger Bands to make your trade more meaningful?
Before selecting the indicator we need to identify why would we need another indicator to complicate things. Because it seems really easy to trade with Bollinger Bands. All we have to do is buy when the candle hits the lower band and sell when the candle hits the upper band. Isn't it easy?
If it works such way we would have been billionaires already. If you look closely in a trading chart you can see that sometime trends will not touch the upper band but continuous to fall downward after a slight pull back. In such case trader can lose in an unfortunate manner.
Hence, we need some indicator which we can use to back up our decision on trend patterns.
After many consideration, the best indicator to use with Bollinger Bands would be the Relative Strength Index (RSI) because it can give us the quick idea of price momentum in the market. RSI indicate price momentum on a scale of 0 to 100 and if the scale has 70+ reading, it means market has overbought momentum and, if the scale reading is 30- means market has oversell momentum.
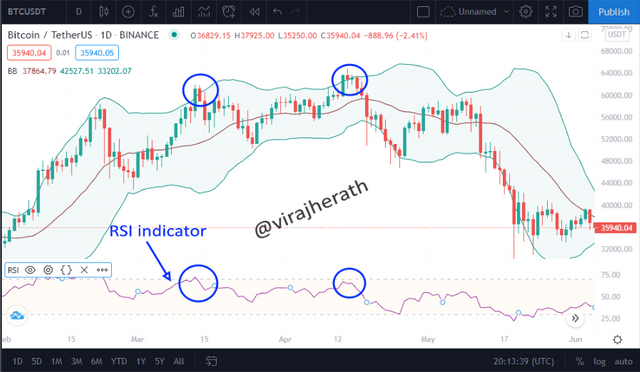
Now we can see that both overbought momentums are indicated in RSI indicator and given us the better idea to improve our next decisions.
What timeframe does the Bollinger Bands work best on? And why?
Since it allows to see the market volatility by previous data points, I don't think there is one particular timeframe which will benefited more. I believe it's a great indicator for all the time frames.
However, the usage might change depend according to the strategy that you use. Because we have discussed that MA & standard deviation can change according to the trading strategy.
Review the chart of any pair and present the various signals giving by the indicator Bollinger Bands
I will review the below BTC/USDT 01days chart,
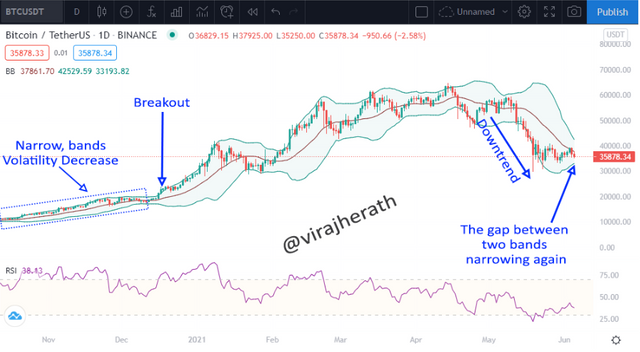
Until mid December market was quite and had narrow bands, the candles were stayed in upper band for entire time and RSI confirmed the Overbought momentum, the build up market pressure can seen here with the breakout.
After mid December we can see drastic uptrend in the market until early January, once again the market is in overbought momentum. Then there was a trend reversal. We can see the bands are widening and the market volatility is high.
After few oversold momentums in February, there is trend reversal again. Upward trend continuous until March. Market volatility still quite high.
After April we can see that market volatility becoming more stable hence the gap between bands are getting smaller. There were a bit of sideways trend went on until mid April.
End of April we can see drastic downtrend with a lot of oversold momentum.
By mid May market is again on sideways and we can see the huge gap between bands are closing the gap. We can predict that market will stay stable for a while with that analysis.
Conclusion
To conclude, Bollinger Bands is a useful indicator to develop a strategy for traders. The Three lines move according to the MA and standard deviation set by the trader. It can give the clear idea about market volatility when the bands narrowing and widening. When there is a low volatility with narrow bands, there is a possibility of a breakout.
When Bollinger Bands indicator combines with RSI there is high probability to determine overbought and oversold estimation. Moreover, the bands can be act as a support and resistance for a trader to understand reversal patterns.
Thank you!
Hello @virajherath,
Thank you for participating in the 8th Week Crypto Course in its second season and for your efforts to complete the suggested tasks, you deserve a 6/10 rating, according to the following scale:
My review :
An acceptable article, where you succeeded in answering some questions and could not convince in others. Try to take each question seriously and write down what is worth answering.
Thanks again for your effort, and we look forward to reading your next work.
Sincerely,@kouba01
Downvoting a post can decrease pending rewards and make it less visible. Common reasons:
Submit
Thanks for the review @kouba01
See you in next season
Downvoting a post can decrease pending rewards and make it less visible. Common reasons:
Submit