Hey Guys..!!
Meet again with me Wahyu Nahrul on the other Steemit Crypto Academy homework. Today I will be working on homework given by one of our professors @dilchamo.
The homework given by our professor this week is about Effective Trading Strategy using Line Charts.

Okay, just get to the discussion. Happy Reading !!

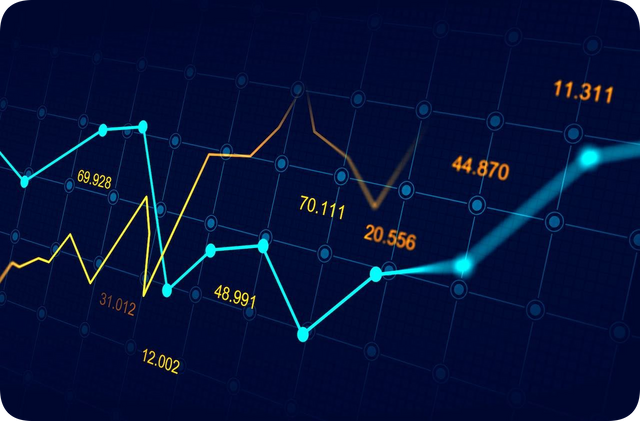
Line Chart
.png)
If we are used to opening websites that provide chart service providers, then we already know that there are many types of charts provided and most of us are already familiar with charts that use the Candlestick type.
But there is one thing we must know not everyone can immediately use a candlestick-type chart to see the price movement of a cryptocurrency, this is because candlesticks are a type of chart that has a high level of difficulty to learn for beginners. Therefore, a chart type was created that has a much simpler appearance and is easily understood by beginners, the name of this chart type is "Line Chart".
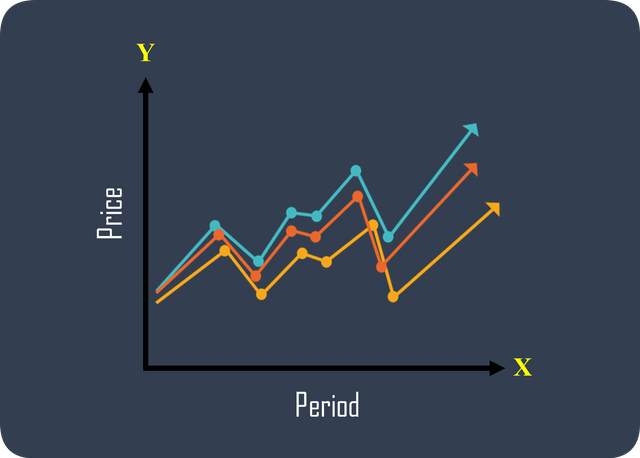
Unlike most other charts, the Line Chart is made in such a way that it has a simpler appearance. As the name suggests, the Line Chart will be illustrated by a line moving on the X and Y axes.
The X-axis is the time period of a cryptocurrency where this period can be in Seconds, Minutes, Hours, Days, Weeks, and Months. While the Y-axis is a presentation of the price of the cryptocurrency, the higher the line moves it indicates that the price of a cryptocurrency has increased.
.png)
In addition, the Line Chart also only shows important information. An example of the information provided by the Line Chart is that it only shows the closing price of a cryptocurrency from a period and that closing price will be connected to the movement of the next Line Chart and become a point of view of the previous price.
By only showing the closing price shown by a line, the Line Chart will be much easier to use because it can eliminate other unimportant information such as the highest price and the lowest price which actually only occurred in a short period of time and did not have much effect on the chart. This also makes Line Charts can be used efficiently for beginners as well as professional traders.

Identifying Support and Resistance Levels Using Line Charts
.png)
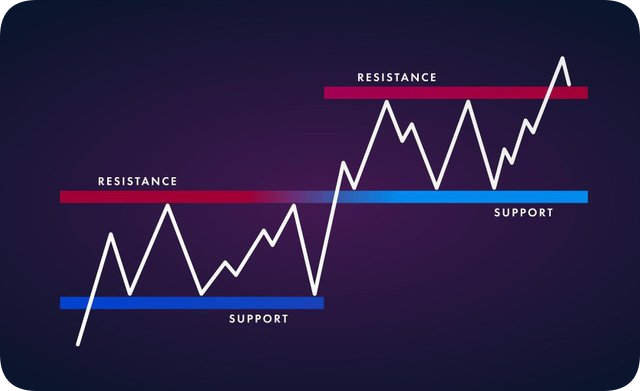
In trading using charts, we certainly already know that there are 2 trendline lines that we must understand from the start even before we start trading, these 2 lines are Support and Resistance Levels.
These two trendlines are formed by drawing a line at a certain point on the chart so that it will become a barrier that will be used as the highest or lowest price limit for a cryptocurrency before we finally decide to enter into a trade.
For the Support Level, this level is a price benchmark line where at that level is the lowest price reached by a cryptocurrency several times in a period, so the Support Level line will be made at the lowest price points of the cryptocurrency shown by the Line Chart.
The Support Level will be used by traders as a reference where if the Line Chart of a cryptocurrency continues to decline and eventually passes the Support Level, they will take action to sell the cryptocurrency assets they have or they will start trading using short positions.
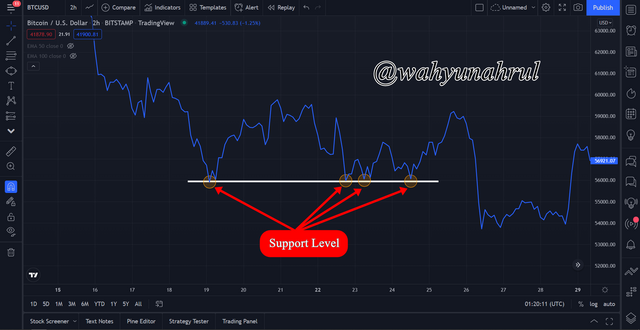
For example, we can see in the BTC/USD chart image above where I use a 2-hour timeframe, we can see that the line from the Line Chart has experienced its lowest decline 4 times at the same level, so we can create a Support Level by drawing a Trendline that will connect the dots. -point, so that a Support Level line will be formed which can be used as a lower limit.
Whereas the Resistance Level is the opposite level of the Support Level, this level is a price benchmark line where at that level is the highest price reached by a cryptocurrency several times in a period, so that the Resistance Level line will be made at the highest price points of the cryptocurrency. This is shown by the movement of the Line Chart.
The Resistance level will also be used by traders as a reference where if the Line Chart of a cryptocurrency continues to increase and eventually passes the Resistance Level, they will take action to buy cryptocurrency assets or they will start trading using Long positions.
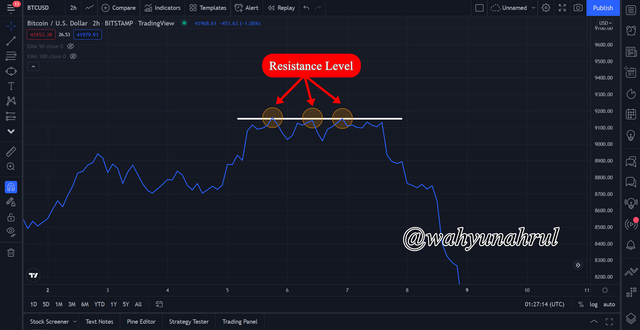
For example, we can look back at the BTC/USD chart image above which also uses a 2-hour timeframe. We can see that the line from the Line Chart has increased in price 3 times at the same level, so we can create a Resistance Level by drawing a Trendline that will connect the points so that a Resistance Level line will be formed which can be used as the upper limit.

Difference Between Line Chart and Candlestick Chart
As I discussed earlier, the Line Chart is a type of chart that is very different from the candlestick chart, apart from the visual appearance, the type of information provided by the Line Chart is also different from the Candlestick Chart.
Maybe many of us already know that a Candlestick on a chart has two parts, the first part is "Candle Body" which shows the opening and closing prices and the other part is "Candle Shadow" which shows the highest price and the lowest achieved by a cryptocurrency in a period. And the difference between Line Chart and Candlestick Chart is in this section.
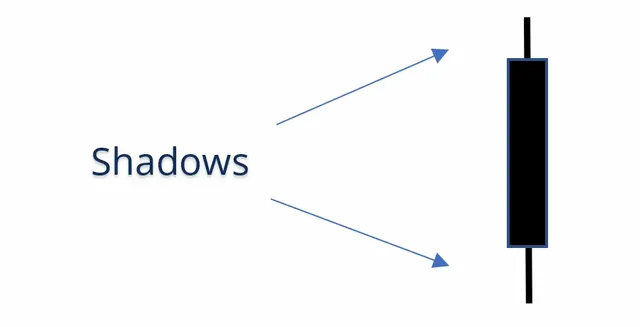
As I explained earlier that the Line Chart only shows the closing price for a period of a cryptocurrency which will be the initial price for the next period, so if the closing price of a cryptocurrency is not at its lowest price at the time of closing, the Line Chart considers it a Level. The lowest of these cryptocurrencies.
For more details, let's take a look at the example below.
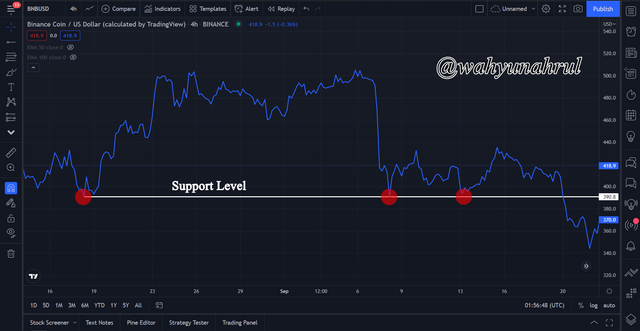
In the graphic above I have drawn the Support Level which is connected to the 3 lowest price points shown by the Line Chart, from this line it can be seen that the lowest price reached by the BNB/USD market in recent times is at $390.8.
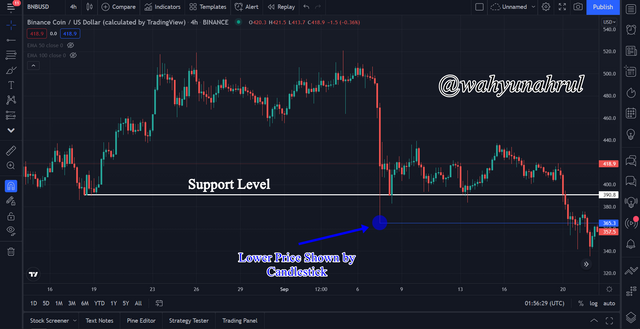
Then I changed the chart type to Candlestick Chart and we can see in the picture above that the lowest price ever reached by the BNB/USD market was not $390.8 but $365.3. This is evidence that the Line Chart and Candlestick Chart have very contrasting differences in the information displayed on the chart.
Maybe for some people, especially professional traders, this will be detrimental to them because the Line Chart does not show the actual lowest price that occurred in a market. But we must know that the lowest price shown on the Candlestick Chart is a visual of the Shadow Candle section which is a price that occurs in a very short period of time, it may only occur a few seconds before rebounding back up.
This also proves that Line Charts can minimize false signals that often make traders anxious when the market is volatile, this will greatly affect the psychology of a trader in making the right decisions.

The Other Suitable Indicators That Can Be Used With Line Charts
The Line Chart is a chart that uses a line to visualize price movements that occur in a cryptocurrency market, therefore Line Charts will be very suitable for use with an indicator that visualizes movement using a line and one of these indicators is the "Exponential Moving Average (EMA)".
EMA is an indicator that shows how the average price movement has occurred in a cryptocurrency market in the past, so this indicator will use price movement data for a past market and make it a benchmark that will become a prediction of where to go. the price of a cryptocurrency will move.
By using the EMA indicator, we can get signals of changes in the direction of the trend that is happening in the market, so that we can make better trading decisions.
Then, we also use the EMA indicator as the Support Level and Resistance Level from the Line Chart, this type of Support and Resistance Level is often referred to as "Dynamic Support and Resistance". This is because the Support and Resistance Levels will continue to change according to the average price movement that occurs in the market, so we don't need to draw a new Trendline every time because it will be automatic.
For a more complete explanation, let's look at the graphic image below. I took the picture from the ETH/USD market chart using a 1-day timeframe and I used 1 EMA line with a length of 100.
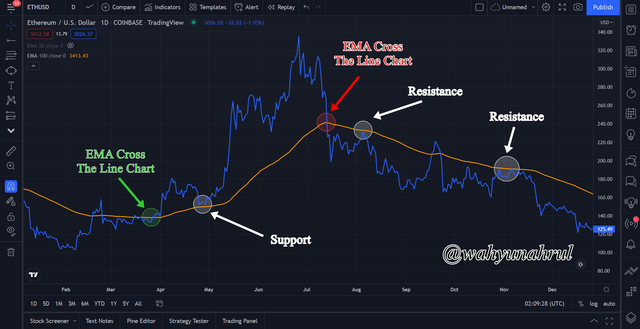
We saw first on the far left that there was a moment where the Line Chart started to cross with the EMA100 line so that at that moment we got a signal that the ETH/USD market will experience a Bullish Trend after the Line Chart also had a correction and touched the EMA100 line but that just a moment and the Line Chart started to rise again. This is one of the roles of the EMA indicator where it becomes a Support Level which if the Line Chart declines to pass the EMA then it is a signal that the trend will change again.
After that, we also got a change in the direction of the trend again where the ETH/USD market was initially in a Bullish Trend has turned into a Bearish Trend, this is indicated by the crossing of the Line Chart with the EMA100 line so that the Line Chart starts to move below the EMA100 line. It is at this time that we can make the decision to sell our crypto assets.
After the Trend has entered the Bearish Trend, the EMA line has started to act as a Resistance Level which will be the upper limit of the ETH/USD market. We can see in the picture there are 2 moments where the Line Chart touched the EMA100 line and then rebounded downwards.
From this example, we can see that the EMA indicator is a very suitable indicator to be combined with the Chart Line for trading.

Bullish and Bearish Trading Opportunities Using Line charts
Now I will show you how to use the Line Chart to take profits when there is a change in the direction of the trend, we can use this so that we can get bigger profits because we enter the trade at the most ideal price.
In this example, I will show how to use a Chart Pattern called "Ascending and Descending Triangle" where this pattern can give us a signal to change the direction of the trend, and I also use the help of the EMA indicator with length 100 to confirm the signal. given by the Ascending and Descending Triangle Patterns.
1. Bullish Trend Trading
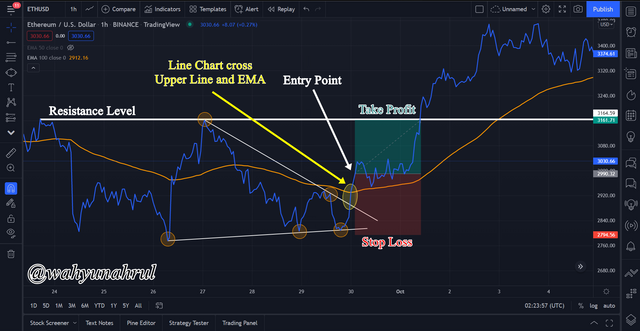
In the graphic image above, we can see that the Line Chart is experiencing a decline and the cycle of decline is getting narrower so that the Descending Triangle Pattern is created. Then the Line Chart starts to increase in price until it breaks the upper limit of the Ascending Pattern which indicates a change in the direction of the trend from Bearish to Bullish.
After a while, the EMA indicator confirms the change in the direction of the trend where the Line Chart also moves up until it crosses the EMA100 line, with this confirmation we can start trading in the next period.
I drew a line at $3164.59 which is the highest price the ETH/USD market has reached in recent times so I set it as a resistance level. Then I also use the Resistance Level as a benchmark for the Take Profit Level of the trades I make and for the Risk/Reward ratio I use a 1:1 ratio.

2. Bearish Trend Trading
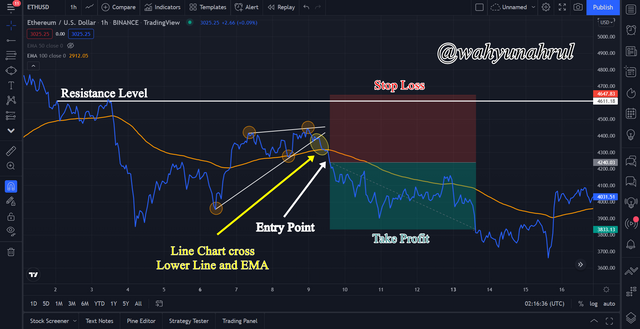
In the graphic image above, we can see that the Line Chart is experiencing an increase and the cycle of improvement is getting smaller and smaller so that the Ascending Triangle Pattern is created. Then the Line Chart began to experience a decline in price until it broke the lower limit of the Descending Pattern which indicated a change in the direction of the trend from Bullish to Bearish.
After a while, the EMA indicator confirms the change in the direction of the trend where the Line Chart also moves down until it crosses the EMA100 Line, with this confirmation we can start trading in the next period.
I also draw a line at the highest price ever reached by the ETH/USD market in recent times which will be used as the Resistance Level. Then I use the Resistance Level as a benchmark for the Stop Loss Level of the trade I make and for the Risk/Reward ratio I use a 1:1 ratio.

Advantages and Disadvantages of Line Charts
From all the explanations that I have made above, we can get some things that are the advantages and disadvantages of the Line Chart. The advantages and disadvantages are as follows:
1. Advantages of Line Charts
Easy To Use For Beginners
With the simple visualization of the Line Chart, it will be very useful for beginners in learning how to read the price movement of a cryptocurrency from a chart. When compared to Candlestick Charts which have several candle parts, colors and etc. are very complex, Line Charts that only use 1 line will be very easy to understand.
Can Give Trend Reversal Signal
If we can combine the Line Chart with the right indicators, then we will be able to get various signals that will be very beneficial for us in trading, this is a mandatory thing that must be learned because it will be a big loss if we can't take advantage of the advantages of this Line Chart.
Eliminate Fake Signals
Because the Line Chart only shows the closing price of a market, we can focus more on trading by looking at the actual price. We will not be distracted by price movements that change suddenly, where these changes are only temporary and have little effect on the market.
Easy to find Support and Resistance Levels
With a simple visualization of the Line Chart, it will be very useful for traders to draw the Trendline which will become the Support and Resistance Levels, this is because traders will not be confused to draw the Trendline because there is no shadow on the Line Chart.

2. Disadvantages of Line Charts
Minimal Information Displayed
For professional traders, they will really need information on what is happening in a market. Therefore, sometimes the Line Chart is not suitable for some professional traders because the information shown is very minimal, namely only the closing price, we cannot know how big the changes are in the market.
Not Suitable In Short Term Trading
As I explained in the previous point that the information displayed by the Line Chart is very minimal, this also has an impact on the type of trading applied by traders when using the Line Chart. Line Charts will be suitable for medium or long-term trading types, but Line Charts will not be suitable for short-term trading such as a minute or even second timeframes where traders will really need complete information about market conditions.
Must Be Combined With Other Indicators
I strongly discourage you from trading using only Line Charts. The Line Chart should always be combined with other auxiliary indicators in order to increase the winning percentage in trading. Because if we force to only use the Line Chart in trading, we will experience a very large percentage of losses, due to the lack of information and confirmation of the signals provided.

Last Word (Conclusion)
The Line Chart is a type of chart that has actually been created for a long time, and this type of chart is very common among traders, but the Line Chart is still underestimated by many people because of the lack of information provided by this type of chart, even though if we dig deeper then we will discover the various advantages that Line Chart can give us and these advantages will be very useful when we trade on the cryptocurrency market.
With the simple visuals provided by Line Chart, it will be very friendly to newcomers who have just started learning how to read the price chart of a cryptocurrency. And by using the Line Chart combined with the right indicators, it is not impossible that the newcomers can get even bigger profits than other experienced traders.
Those are some of my explanations regarding Effective Trading Strategy using Line Charts, I apologize if there are still many mistakes that you can get when reading my explanation earlier, I would be very grateful if you told me in the comments column below.
Thank you for reading my blog, hope it will be useful for all of you. 😁


Very good explanation. I also think i can participate to this assignment.🙌
Downvoting a post can decrease pending rewards and make it less visible. Common reasons:
Submit
Thank you, if you meet the minimum requirement, please participate to enliven this new season 👍
Downvoting a post can decrease pending rewards and make it less visible. Common reasons:
Submit