Hey Guys..!!
Meet again with me Wahyu Nahrul on the other Steemit Crypto Academy homework. Today I will be working on homework given by one of our professors @reminiscence01.
The homework given by our professor this week is about Psychology of Trends Cycle.

Okay, just get to the discussion. Happy Reading !!

The Dow Theory
.png)
There are so many candlestick patterns that have been discovered so far, each of these patterns is based on the behavior of people who trade in a market. Likewise with a trend, until now there have been many trading experts in the world who have conducted research on the cycle of trends that occur in the market.
According to experts, the trend in the market has its own cycle where if we can study the cycle properly then we will be able to profit by entering trades in the right trend cycle. There is a well-known theory that discusses the psychology of trend cycles called "The Dow Theory".
The Dow Theory is a theory created by Charles H. Dow which was published in 255 Wall Street Journal. Charles Dow is a journalist and editor who works for the magazine.
Initially, this theory was not perfect when published in the magazine until finally perfected by Robert Rhea in his book entitled "The Dow Theory" which was made after the death of Charles H. Dow in 1902.
According to this theory, a market has 3 distinct phases:
First Phase (Accumulation): This is the buying phase made by investors at the beginning.
Second Phase: This phase is a phase where retail investors start competing to participate in making purchases, resulting in a high price increase.
Third Phase (Distribution): In this phase investors start selling the assets they bought in the first phase and start taking profits from the trades they make.
From the 3 phases given by this theory, we can see that market price movements are closely related to the psychology of each individual investor who participates in the market.
.png)
I personally think this Dow Theory is a very good theory and can be used in technical analysis in a cryptocurrency market. I say this because studying market behavior is a very important thing to do, psychology is a very important thing for all traders to know because what moves the candlesticks on a chart is the result of buying and selling made by traders who trade in a market.
In addition, by using the Dow Theory in technical analysis, we will have the advantage of seeing the movement of the trend direction that occurs in the market using the phases previously mentioned. By knowing the movement of the trend direction, we can trade by entering in the best position so that we can also get the maximum profit possible.

The Psychology Behind The Accumulation and Distribution Phases
The Accumulation Phase and the Distribution Phase are 2 pairs of phases that traders must learn in trading, as we know that price movement in the market will continue to fluctuate which will go up and down in a period. I will explain how the psychology of the market when it is in both phases.
1. Accumulation Phase
At the beginning of this phase, the market price tends to decrease due to the large number of sellers who dominate the market so that the market is in a Bearish Trend. Then large investors (whales) will start making purchases at that low price, thus creating a buying resistance that occurs in the market so that prices will be stable in a range and volatility tends to be low, when prices go up and down within this range, this is what is known as "Accumulation Phase".
Then because there is a continuous purchase by these whales, there is an increase in the volume of buying trade which has an impact on increasing prices. And it is at this time that retail investors begin to know that the whales have entered the market and they start competing to enter the market with a buy position in order to benefit from the price increase, thus making the Candlestick penetrate the price range in the Accumulation Phase and the trend that occurs in the market into a Bullish Trend.
When the market is experiencing this Bullish Trend, there is a moment where the whales start to take advantage of the investments they have made so that price movements become stagnant again for a while which is the same as in the Accumulation Phase, this moment is called "Reaccumulation ". For example, we can see this in the graphic image below.

However, we must also be aware of the possibility of a change in the direction of the trend in this Reaccumulation Phase, because there are also sometimes moments where the candlestick does not even penetrate the Resistance Level and instead penetrates below the Support Level so that the phase that occurs becomes the Distribution Phase which I will discuss after this.

And usually, if he breaks the Support Level he will pull back to retest to the Support Level before finally, the candlestick continues to decline until it turns into a Bearish Trend.

2. Distribution Phase
Distribution Phase is the opposite phase to the Accumulation Phase, this phase is the beginning of a change in trend direction from a Bullish Trend to a Bearish Trend. At the beginning of this phase, the market price tends to stagnate in a certain range such as in the Accumulation Phase, this is due to the large number of whales that have started to dominate the market to sell their assets.
However, in the market, there is still resistance from retail investors who are still convinced to buy the crypto asset so that prices continue to stay within that range and volatility tends to below. Then big investors (whales) will start making massive sales, causing a change in the direction of the trend shown by the candlestick when it breaks the Support Level.
Due to the continuous selling by these whales, there is an increase in the volume of selling trades in the market which makes retail investors panic to get out of the trade which has an impact on the price decline which is getting deeper.
When the market is experiencing this Bearish Trend, there is a resistance made by retail investors where they make purchases so that the candlestick movement becomes stagnant again and buys a price range, this moment is called "Redistribution". For example, we can see this in the graphic image below.

However, we must also be aware of the possibility of a change in trend direction in this Redistribution Phase, because there may be a possibility that those who made the purchase were other whales who made the candlestick not even penetrate the Support Level and did not continue the Bearish Trend but the candlestick instead penetrated upwards. towards the Resistance Level so that the phase that occurs becomes the Accumulation Phase.
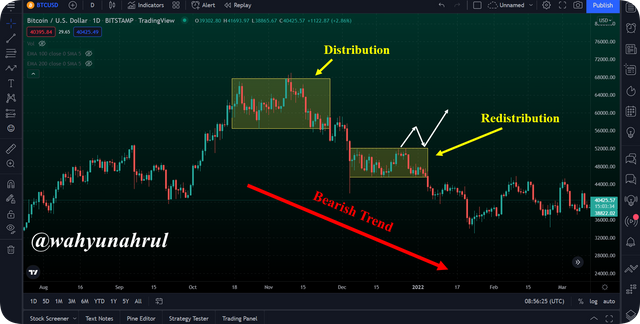
And usually, if it breaks the Resistance Level it will pull back to retest to the Resistance Level before finally, the candlestick continues to increase until it turns into a Bullish Trend.

The 3 Phases of The Market and How It Can Be Identified on The Chart
There are 3 phases that occur in a market according to Dow Theory, this phase we can also call the trend that is happening in the cryptocurrency market, the phases in question are Bullish Phase, Bearish Phase, and Sideway Phase. To find out how to identify all of these phases, we have to look at the patterns created by candlestick movements, by looking at these patterns we can identify a phase that was created in the market.
1. Bullish Phase
To identify the Bullish Phase, we must first know that the trend is increasing periodically over a long period of time. Then we also have to look at the highest and lowest price points created on the chart made by the movement of the candlestick, during the Bullish phase the candlestick will make a high point whose price is higher than the previous high point and the candlestick must also make a lower point that costs higher than the previous low.

In the picture of the ETH/USD market above, we can see the movement of the candlestick that forms the Bullish Phase. The candlestick as a whole moves up and makes several highs and lows, at the highest points it always has a higher price than the previous high and at the lowest points it creates it always has a higher price than the lowest point. previously. From the characteristics shown, at that time the ETH/USD market was in a Bullish Phase.

2. Bearish Phase
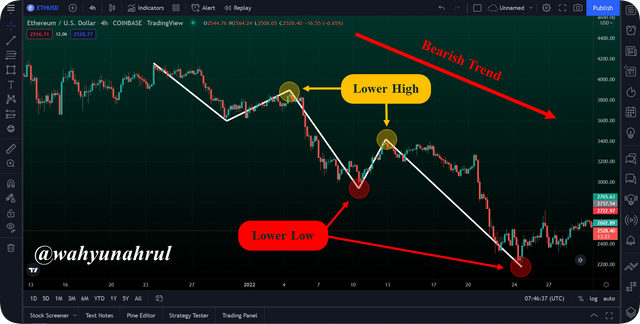
To identify the Bearish Phase, we must first know that the trend is experiencing a periodic decline over a long period of time. Then we also have to look at the highest and lowest price points created on the chart created by the movement of the candlestick. During the Bearish Phase, the candlestick will make a high point whose price is lower than the previous high point and the candlestick must also make a low point whose price is lower than the previous low.
.png)
In the ETH/USD market picture above we can see the movement of the candlestick as a whole move downwards and makes several highs and lows, at the highest points it always has a lower price than the previous high, and at the lowest points created then it always has a lower price than the previous low. From the characteristics shown, at that time the ETH/USD market was in a Bearish Phase.

3. Sideway Phase
It will be very easy to identify the Sideway Phase, what we must know first is that the market is not in any trend in the span of several periods. Then we also have to look at the highest and lowest price points created on the chart created by the movement of the candlestick.
In contrast to the previous phases, during the Sideway phase, the candlestick will make the highest point whose price is the same as the previous high point and the candlestick must also make the lowest point whose price is the same as the previous lowest point so that the candlestick forms a price range before finally breaking out with one of the limits. in that price range.
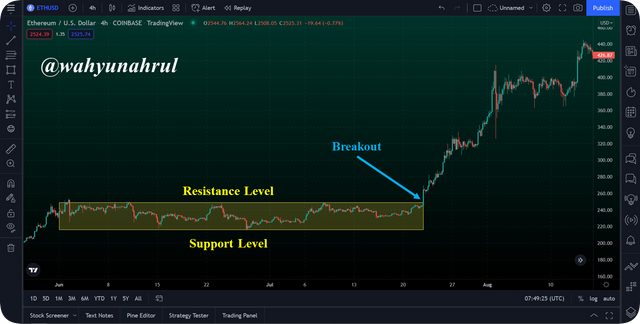
In the picture of the ETH/USD market above, we can see the movement of the candlestick that forms the Sideway Phase. The candlestick as a whole moves in a horizontal direction and makes several highs and lows in a price range, at the highest points it always has the same price as the previous high and at the lowest points created it always has the same price as at the lowest point before. From the characteristics shown, at that time the ETH/USD market was in Sideway Phase.
And in the chart above the candlestick finally broke with the Resistance Level and continued the Bullish Trend after being in the Sideway Phase for a very long time.

The Importance of The Volume Indicator in Confirm a Trend
The existence of the Volume Indicator is closely related to the use of Dow Theory, according to this theory the market psychology that is created can be seen by looking at how much trading volume occurs in a market, if the trading volume that occurs has increased, then the market will be volatile and result in volatility of price movements. which can eventually create a new trend.

For example, we can see in the picture above which shows how the Volume Indicator gives a signal to confirm the direction of the trend.
In the first section which is on the left of the picture we can see the Volume Indicator does not show any trading volume movements in the market, and when we look at the candlesticks the market is indeed in the Sideway Phase or Accumulation Phase.
After that, there was the creation of very high volatility where the price began to experience a very significant increase in the market, and there was an indication that the trend in the market was in a Bullish Trend. And this indication is confirmed by the Volume Indicator where the Volume Indicator shows an increase in the volume of buying trades in the market.
After the Bullish Trend is complete, the market begins to enter the Distribution Phase where the candlestick moves in a price range that has an upper and lower limit as in the first section. And here the Volume Indicator also confirms this phase by showing no significant movement in trading volume.
Finally, the candlestick experienced volatility again where the candlestick moved downwards to create a Bearish Trend. And the Volume Indicator also confirms the trend with an increase in selling volume in the market.
From this example, we can see how the Volume Indicator plays an important role in identifying a phase/trend that is in the market, and we can also see the attachment of the amount of trading volume to changes in trend direction that will occur in a cryptocurrency market.

The Trade Criteria For The Three Phases of The Market
In trading using Dow Theory, there are several criteria that we must know in advance and learn in advance in order to get maximum profit while reducing the possibility of loss when trading. These trading criteria are divided based on the phases that are happening in the market.
1. Trading Criteria For Bullish Phase
To trade in the Bullish Phase, there are several things that we must pay attention to first, these include:
We have to make sure that the current trend in the market is in a Bullish Trend during the previous several periods.
The candlestick must form several Higher High and Higher Low points which have a higher price than the previous point.
When the candlestick has formed the latest Higher Low, then we have to wait for a reversal of the direction of the candlestick's movement towards the top and create several Bullish Candlesticks.
Enter a trade when a Bullish Candlestick has formed with Long Position.
Place the Stop Loss Level below the price from the last Higher Low point and use the Risk/Reward Ratio 1:1, 1:2, etc. to place the Take Profit Level.
For more details, please see the graphic image below.


2. Trading Criteria For Bearish Phase
To trade in the Bearish Phase, there are several things we must pay attention to first, these include:
We have to make sure that the current trend in the market is in the Bearish Trend during the previous several periods.
The candlestick must form several Lower High and Lower Low points which have a lower price than the previous point.
When the candlestick has formed the latest Lower High, then we have to wait for a reversal of the direction of the candlestick's movement towards the bottom and create some Bearish Candlesticks.
Enter a trade when a Bearish Candlestick has formed with Short Position.
Place the Stop Loss Level above the price from the last Lower High point and use the Risk/Reward Ratio 1:1, 1:2, etc. to place the Take Profit Level.
For more details, please see the graphic image below.


3. Trading Criteria For Sideway Phase
In contrast to the Bullish and Bearish Phases, I strongly do not recommend trading in the Sideway Phase, this is because this phase is very vulnerable to being exposed to false signals given by candlestick patterns. But even so, there are still many professional traders who trade in the Sideway Phase, because in this phase we can still get profit even though the profit is small, but another advantage is that we can get profit with the same pattern in a very short time.
The way to trade in the Sideway Phase, we must pay attention to several things first, such as we must first determine the Support Level and Resistance Level of the pattern made by the candlestick. After that we have to set the Stop Loss Level and Take Profit Level to the Support Level and Resistance Level, if the candlestick breaks one of these levels then we have to get out of the trade as soon as possible because at that time the Sideway Phase in the market might have ended.
For more details, let's look at the example graph below.
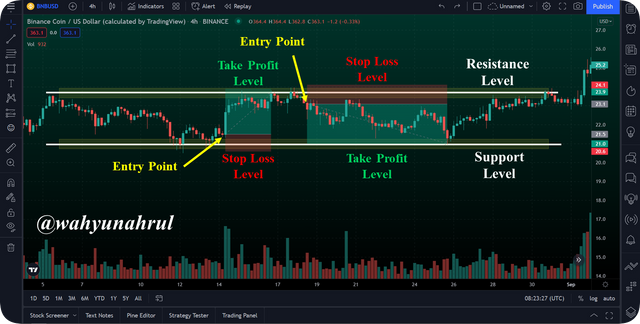
In the picture above I have drawn 2 Trendline lines which are the Support Level and Resistance Level for the BNB/USD market which is in the Sideway Phase. In the first example, we saw that the candlestick touched the Support Level and after that, a Bullish Candlestick was created on the chart, at that time we could open a trade with a Long Position and when the candlestick touched the Resistance Level, we could exit the trade and take profit.
Shortly after touching the Resistance Level, the Candlestick begins to reverse towards the Support Level, and a Bearish Candlestick is formed, at this moment we can open a new trading position with a Short Position. When the candlestick has touched the Support Level, we can close the order and take profit.
From the example above, we can see that we can still get profit by trading even in the Sideway Phase. But it must be remembered that trading in the Sideway Phase is very risky to experience loss and trading in this Phase is more intended for professional traders who already understand these risks.

The Demo Trade for Buy and Sell Positions
Now I will show you how to trade using Dow Theory on two positions (Buy and Sell). In this example, I will use the Volume Indicator as an auxiliary indicator in identifying the conditions that are happening in the market, and I trade this using a Demo account on the TradingView platform.
1. Buy Position
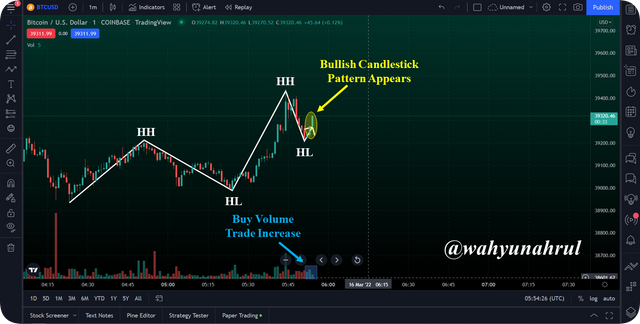
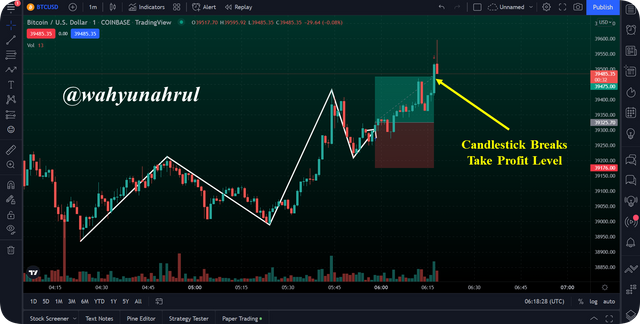
In the BTC/USD market with a 1-minute timeframe, I saw the creation of a Bullish Phase pattern which was marked by the formation of 2 Higher Highs and 2 Higher Lows, then the Volume Indicator also showed an increase in the volume of purchases in the market. After waiting for a while, I also saw that there was a bullish candlestick that was long enough in the market so that this proves that the market is indeed in a Bullish Phase.
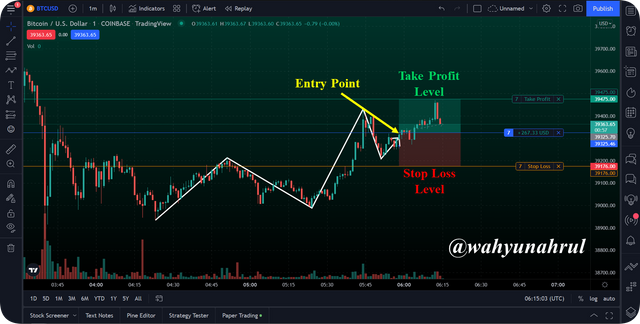
After that, I decided to enter a trade with Long Position at the price of $39,325.46, then I set the Stop Loss Level below the last Higher Low point created, the Stop Loss Level was at the price $39,176.00. By using Risk/Reward Ratio 1:1 and based on the Stop Loss Level that I have determined earlier, I place the Take Profit Level at the price of $39,475.00 as shown in the chart below.
To see the details of the order that I made, please look at the image below.
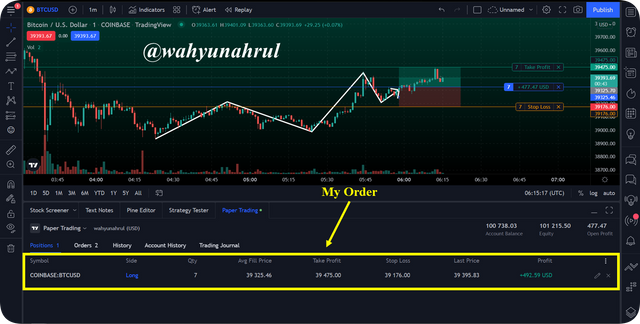
After a while, the movement of the candlestick finally moved up and passed the Take Profit Level that I had set as shown in the image below, so the order that I made was closed automatically.
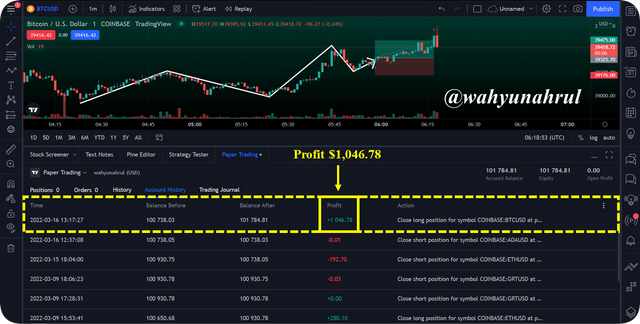
From the trades I made, I managed to earn an extra $1,046.78 on my demo account on the TradingView platform.

2. Sell Position
Next, I will show you how to trade on Sell Positions. In the ETH/USD market with a timeframe of 1 minute, I saw the creation of a Bearish Phase pattern which was marked by the formation of 2 Lower Highs and 2 Lower Lows. Then the Volume Indicator also shows an increase in sales volume in the market. After waiting for a while, I also saw the creation of a Bearish Candlestick in the market so this proves that the market is indeed in a Bearish Phase.
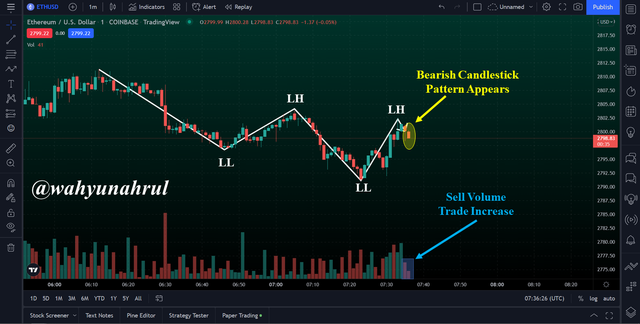
After that I decided to enter into a trade with Short Position at the price of $2,789.54. Then I set the Stop Loss Level above the second and last Lower Higher point created, here I improvised a bit in determining the Stop Loss Level because I think the price distance between the 2 Lower Higher points created is very close and I also considered too about the high volatility level of the cryptocurrency market, here I am taking a Stop Loss Level that is higher than usual so that the specified Stop Loss Level is at $2,807.00.
By using Risk/Reward Ratio 1:1 and based on the Stop Loss Level that I have set earlier, I place the Take Profit Level at the price of $2,789.00 as shown in the chart below.
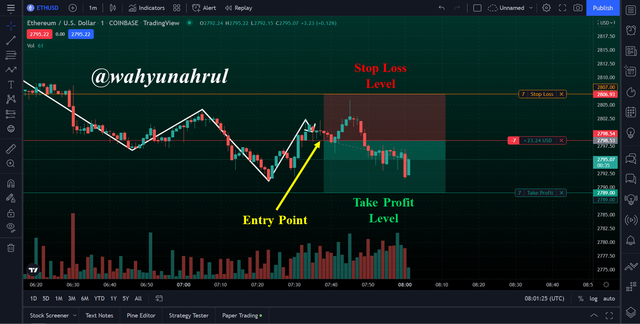
And we can see in the movement of the candlestick in the picture above that the price has already broken through to the previous Lower High point, so if I don't take a higher Stop Loss Level then the trade I made is closed and I suffer a loss.
To see the details of the order that I made, please look at the image below.
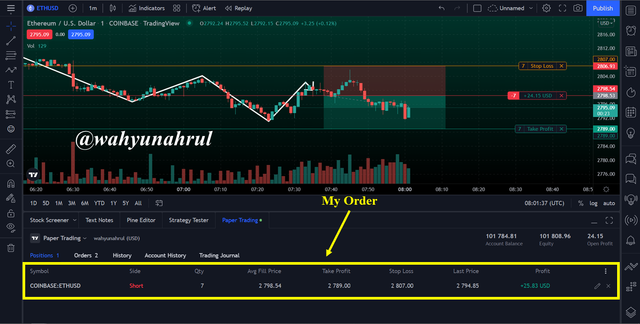
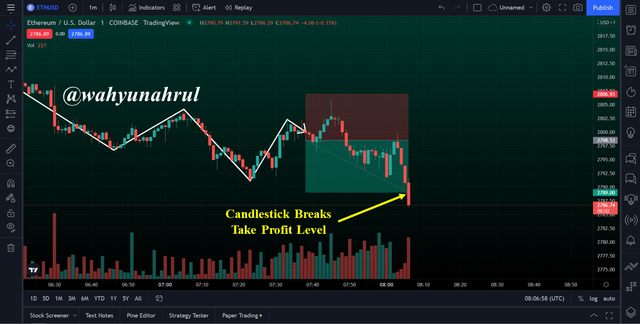
After a while, the movement of the candlestick finally moved down and passed the Take Profit Level that I had set as shown in the image below, so the order that I made was closed automatically.
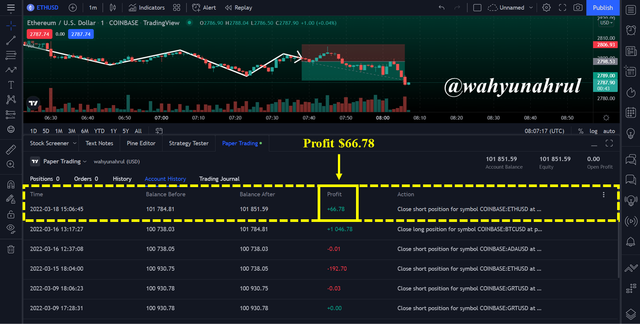
From the trades I made, I managed to earn an extra $66.78 on my demo account on the TradingView platform.

Last Word (Conclusion)
From all the discussions that have been made above, we can see that the Dow Theory is indeed very good for technical analysis in a cryptocurrency market, by knowing market psychology and getting the possibility of trend direction movement, we will increase the profit percentage when trading.
In addition, we also have to be flexible in trading using this method, because if we only rely on one method then we can also be trapped into losses, for example like the trade I did in the last discussion for short positions where if I set the Stop Loss Level which is too low then I will lose, while because I set it higher then I can avoid loss and even get a big profit.
Those are some of my explanations regarding the Psychology of Trends Cycle, I apologize if there are still many mistakes that you can get when reading my explanation earlier, I would be very grateful if you told me in the comments column below.
Thank you for reading my blog, hope it will be useful for all of you. 😁


