Hey Guys..!!
Meet again with me Wahyu Nahrul on the other Steemit Crypto Academy homework. Today I will be working on homework given by one of our professors @cryptokraze.
The homework given by our professor this week is about Trading Liquidity Levels The Right Way.

Okay, just get to the discussion. Happy Reading !!

The Liquidity Level
Before we discuss what Liquidity Level is, we must first understand what Liquidity is. Liquidity is a moment that describes how fast the trading level of an asset is, liquidity can move fast or slow depending on the movement of trading volume that is happening at that time.
From the explanation about liquidity, we can understand that the Liquidity Level is an area that is experiencing changes in trading prices with large volumes in a short time, with this price change causing a sharp price reversal in the market.
This usually happens when the trend of an asset is at its peak, both in the Bullish and Bearish phases. Liquidity levels are usually indicated by a candlestick at the top of the trend and it has a long shadow, after which the trend will reverse from the previous trend.
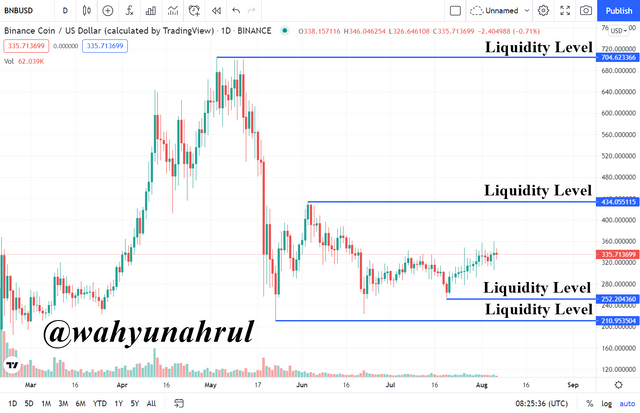
For example, you can see in the chart above, this time I used a chart from Binance Coin with a 1-day timeframe. You can see on the chart that there are several Liquidity Levels that occur, and almost all of them have the same characteristics, namely, they have a fairly long shadow and after that, a reversal trend will occur.
At the first Liquidity Level, you can see that after BNB touched the price of US$704,623 the price of BNB decreased. This was due to the resistance to market demand indicating that many people were selling their BNB at the time.

Trapped in Fakeouts
Trading on a crypto asset is not as smooth as we think. Although we have learned various things in the world of trading, this is not a guarantee for traders to get a profit. This often happens to traders who tend to rush in making decisions to enter trading on a cryptocurrency.
Even though we have determined a Liquidity Level, it does not mean that it guarantees that the Liquidity Level is correct because it could just be a trap that has been made by big investors like Whales.
Whales often trap other retail investors who hope that the trend will continue in accordance with the wishes of these retail investors. The Whales will wait first when the chart starts to break through the previous Liquidity Level and at this time many small investors will start to enter the trade. However, these whales will trade inversely with the current trend and of course with a very large volume that causes the trend to reverse direction. The position where these small investors start trading and are caught by the Whales trap is called Fakeout Area.
Fakeout Which Makes Buyer Trapped
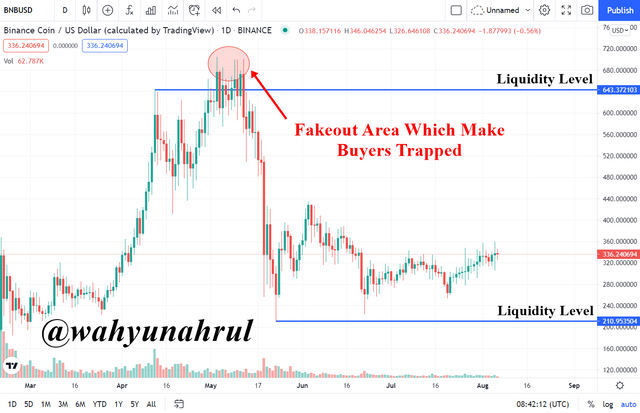
For the first example, we can see in the chart above, this time I'm still using the BNB/USD chart with a 1-day timeframe. At first, the BNB chart already showed its highest level at US$643.37, then the price declined for a while and many investors have started to peg the price of US$643.37 as their support level. Then the price rose again through the support level they had made and many investors flocked to start trading.
However, it turned out that after only a moment the price broke through the support level there was a fairly large price reversal in a fairly short time. The price fell until it penetrated the initial price of US$643.37 and made the trend reverse from Bullish to Bearish.
Fakeout Which Makes Seller Trapped
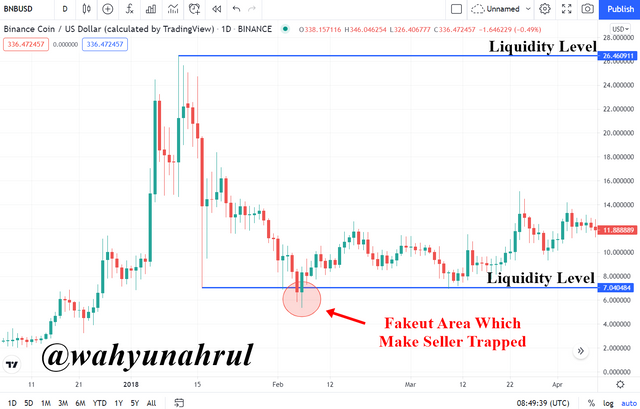
For the next example, we can see in the graph above. At first, the BNB chart showed a decline in price to US$7.04. Even though it had experienced an increase for a while, BNB continued to show a continuation of the trend until it broke through US$7.04. However, a few moments later there was a trend reversal which resulted in the price of BNB rising and breaking through the price of US$7.04.

Trading The Liquidity Levels The Right Way
After we understand that every trade has no certainty that will make us profit, then this time I will show you how to trade using the correct Liquidity Level. In accordance with the learning that has been given by professor @cryptokraze there are two strategies that we can use to minimize our loss rate, the strategy I mean is the Market Structure Break (MSB) strategy to indicate a reversal pattern and the Break Retest Break (BRB) strategy for continuation trading.
For this time I will show an example of how to trade in 2 positions, namely a Buy position and a Sell position using these two strategies. For the example of the "Buy" position, I will use the Market Structure Break (MSB) while for the example of the "Sell" position I will use the Break Retest Break (BRB) strategy.
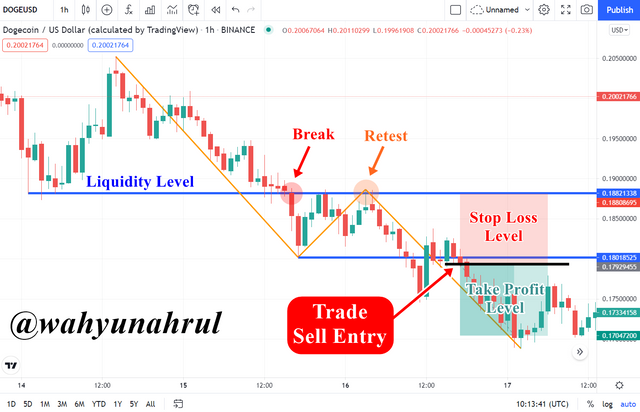
The example chart that I will take this time is DOGE/USD with a 1-hour timeframe.
1. Buy Position With Market Structure Break (MSB) Strategy
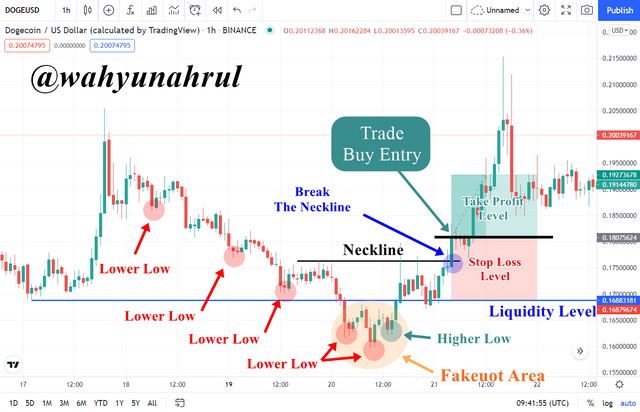
Before we decide to enter a trade in a Buy position using the Market Structure Break (MSB) strategy, there are several things that we must monitor first, including:
The market trend at that time must be experiencing a Bearish phase.
There has been a decline at every low made on the chart. You can prove this by seeing if there is a series of "Lower Low".
After that there was a price increase at the lowest price of the candlestick (Higher Low) which made indicate that there was a trend reversal from Bearish to Bullish.
Pull the Neckline after the Higher Low is formed, this line will be a support line that will be used as a price confirmation level.
Wait for confirmation until there is a long bullish candlestick that breaks the neckline. This is called Market Structure Break.
After that open the "Buy" position right at the candlestick price that has broken the confirmation line/neckline.
Set the Take Profit and Stop Loss ratio according to your wishes with the condition that you enter the lowest level of Stop Loss until it touches the Liquidity Level.
For more details, you can look at the chart below.
2. Sell Position With Break Retest Break (BRB) Strategy
Before we decide to enter a trade in a Sell position using the Break Retest Break (BRB) strategy, there are several things that we must monitor first, including:
Draw the Liquidity Level line which we will make as Support Level.
The market trend at that time should be Bearish.
The market must approach the marked Liquidity Level/Support Level.
After that, wait until the price breaks the Liquidity Level and makes a swing low point.
Then the price has to increase slightly to retest the Liquidity Level and after that, it will start moving down again.
Price must be confirmed by breaking the swing low.
After that open the "Sell" position right at the candlestick price that has broken the swing low line.
Set the Take Profit and Stop Loss ratio according to your wishes with the condition that you enter the lowest level of Stop Loss until it touches the Liquidity Level.
For more details, you can look at the chart below.

Drawing Liquidity Levels Trade Setups On 4 Crypto Assets
This time I will give 4 examples of trading with 4 different cryptocurrencies. Just like before, I used 2 strategies which are Market Structure Break (MSB) and Break Retest Break (BRB) with "Buy" and "Sell" positions respectively. The cryptocurrencies that I chose include:
- Terra (LUNA) as an example of MSB Trade Buy Position.
- Litecoin (LTC) as an example of MSB Trade Sell Position.
- Solana (SOL) as an example of BRB Trade Buy Position.
- Chainlink (LINK) as an example of BRB Trade Sell Position.
The timeframe used on all charts is 1 hour with a risk ratio of 1:1.
1. MSB Trade Buy Position
.png)
2. MSB Trade Sell Position
.png)
3. BRB Trade Buy Position
.png)
4. BRB Trade Sell Position
.png)

Last Word (Conclusion)
There is no guarantee that we will always benefit from the trades we make because market conditions will always change in a very short time. Therefore we must continue to learn the correct ways of trading in order to minimize the losses that occur and do not let us get caught in traps that should not happen.
Those are some of my explanations regarding trading with Trading The Dynamic Support & Resistance, I apologize if there are still many mistakes that you can get when reading my explanation earlier, I would be very grateful if you told me in the comments column below.
Thank you for reading my blog, hope it will be useful for all of you. 😁

