Hi everyone! I welcome you to the second week of cryptoacademy season six series. This week, professor @shemul21 took us on a topic titled "Crypto Trading with Moving Average" at the end of which he gave us an assignment. This is my response to the assignment he gave.
Question 1: EXPLAIN YOUR UNDERSTANDING OF MOVING AVERAGE.
The Moving average indicator is a type of indicator which is trend-based. This indicator is obtained by calculating within a specific interval, the general average movement of the price of an asset.
On a price chart, you will notice the Moving average indicator as a single continuous oscillating line on the price chart which shows the whether the current trend of the market is bullish (upward trend), bearish (downward trend), or that the market is moving in sideways or ranging. It is also used to reveal trend reversals, resistance and support levels, and also several other trading opportunities which can be found in the specified period.
The secret behind the moving average indicator is that the moving average works by first picking a specified period of consideration, then calculating the average price within that period after which the calculated average of price is then plotted on the price chart.
When using the moving average indicator, if the market is in an upward trend, you will notice that the moving average indicator line is positioned below the price movement of the asset. Once you notice this, it confirms that the market is actually moving in an uptrend direction.
Once in a while, you will notice that the price of the asset moves very close to the MA indicator, and rejects it. When this happens, it means that that the market pullback has ended, and thus, the market has began to move once again in it's former upward trend movement.
In the same way, if the market is in a downward trend, you will notice that the moving average indicator line is positioned above the price movement of the asset. Once you notice this, it confirms that the market is actually moving in a downtrend direction. Also, if you notice that the price of the asset moves very close to the MA indicator (while in pullback), and rejects it. When this happens, it means that that the market pullback has ended, and thus, the market has began to move once again in it's former downward trend movement.
From all this, we can see that moving average indicator is very important to crypto traders as it can be used to confirm trend movement of an asset regardless of the period in consideration.
Question 2: WHAT ARE THE DIFFERENT TYPES OF MOVING AVERAGE? DIFFERENTIATE BETWEEN THEM.
Basically we have three main types of moving averages, they are:
1- Simple Moving Average (SMA):
The Simple Moving average is a type of moving average in which the moving average line follows the price movement of an asset very closely. This line is calculated over a specified period using the average closing of price. One important thing to know about simple moving average is that all the price points are considered and represented equally. This in turn makes the price representation of the asset very very smooth. Just like other types of moving average, the simple moving average line always extended further at the close of a candlestick in reference to the newly adjusted average.
The formular for calculating simple moving average is given below:
SMA = (P1 + P2 + P3 + ... + Pn) / n
Where:
P = represents the price at a given interval
n = represents number of periods
One of the importance of Moving Averages is that it gives us a clear indication of how the activities and how exactly the market is actually moving, thus enabling the trader eliminate the false signals in the chart.
Another importance of moving average is that it provides the trader with good trading opportunities depending on the timeframe under consideration. For instance, traders or investor who trade the market in long-term e.g swing traders normally use higher period number like 50, 100, 200 while using simple moving averages. This period represents the number of candles within the timeframe under consideration.
Short-term trader or scalpers uses shorter timeframe like 8, 10, 13, 20, etc. This timeframe represents the number of candles within the specified period.
2- Exponential Moving Averages (EMA):
Exponential moving average looks very much like the Simple moving average, the major difference between them is in how they are calculated. When calculating the Exponential moving average, we consider the newest price movement data changes. Since, exponential moving average follows the price movement of the asset very closely, it's not surprising that it indicates changes in trend and price movement faster than simple moving average. This is why most traders prefer to use it during their technical analysis to determine support and resistance level as well as movement of asset price.
The mathematical formula used in calculating the exponential moving average is given below:
EMA = Cp × multiplier + EMAprev × (1-multiplier)
Where;
Cp = represents the closing price
EMAprev = represents the previous day EMA
Multiplier = the value for multiplier is calculated using the expression : multiplier = (2 ÷ periods + 1).
EMA lays more emphasis on the most recent data of the asset price. Thus, once a new data is obtained, the previous one become more or less important. This constant reaction to new data makes EMA react faster to the price movement of an asset more than what we see in SMA. Thus, EMA can give a trader an early indication of what the market movement may likely be like.
Just like SMA, the period under consideration is set depending on the type of trader and what trading system he uses. Long-term traders e.g swing traders normally use higher period number like 50, 100, 200 while using exponential moving averages. This period represents the number of candles within the timeframe under consideration.
Short-term trader or scalpers uses shorter timeframe like 8, 18, 21, etc. This timeframe represents the number of candles within the specified period.
3- Weighted Moving Averages (WMA):
Another type of moving Average is the weighted moving average. This type of moving average is the type that pays much attention to the price points that are most recent more than other previous asset's price data. It is similar to the exponential moving average only differing on how it is calculated.
When calculating the Weighted moving average, we multiple each candle by the weighted factor. It is this weighted factor that allows the weighted moving average to focus more on the price points that are most recent while at the same time making sure that when the weighted averages are summed up, the value will be 1 or 100%.
The mathematical formula used in calculating the weighted moving average is given below:
WMA = P1 × n + P2 × (n-1) + ... Pn / [n × (n+1)] / 2
Where;
n = represents the number of periods
P = represents the price points.
Just like SMA and EMA, the period under consideration is set depending on the type of trader and what trading system he uses. Long-term traders e.g swing traders normally use higher period number like 50, 100, 200 while using weighted moving averages. This period represents the number of candles within the timeframe under consideration.
Short-term trader or scalpers uses shorter timeframe like 8, 18, 21 WMAs etc. This timeframe represents the number of candles within the specified period.
Below are some of the differences between SMA, EMA and WMA.
1. Difference in identification of Trend:
SMA
Amongst the three, SMA is best when it comes to identifying long-term trading opportunities as it is the only one that considers the average price of an asset during it's representation.
EMA
Amongst the three, it is the EMA that is the most ideal when it comes to identifying short-term trading opportunities as it places so much priority on the recent changes in the price of an asset.
WMA
Amongst the three types of moving average the WMA is the most ideal when it comes to identifying short-term trading opportunities as it places so much priority on the recent price points of the asset.
2. How these moving averages are Calculated:
SMA
When calculating simple moving average, you calculate it based on the average of the price data of an asset at that given interval. This implies that every point of the asset is considered in defining simple moving average.
EMA
When calculating exponential moving average, you calculate it based on the recent changes of the price data of an asset at that given interval. This implies that the most recent data are given more preference than previous data when defining simple moving average.
WMA
When calculating weighted moving average, you calculate it based on the recent price points of an asset at that given interval. This implies that the weighted factor is applied to the price points which are of most recent.
3. Their reaction to Price:
SMA
Amongst the three types of moving average the SMAs react more slowly to changes in the price of an asset because of the fact that it priorities the average price of the asset. applied average smoothing.
EMA
EMAs react more faster to change in price than SMA, as it prioritizes the recent price change data.
EMA
EMAs react more faster to change in price than SMAs and EMAs, as it prioritizes the recent price points.
Question 3: IDENTIFY ENTRY AND EXIT POINTS USING MOVING AVERAGE. (Demonstrate with Screenshots)
Before we can identify entry and exit points of a trade using moving averages, we need to understand first trends and trend structures as moving averages is best used in trending markets. Below are some of the ways of identifying both entry and exit points.
1. Moving Average and Price Action
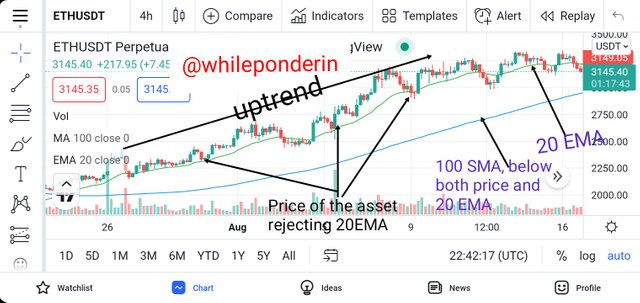
When identifying entry and exit points in a trade, It's possible to combine two of the moving averages. For instance, in the chart below, I used 20 EMA and 100 SMA.
When using a moving average in an uptrend, you will notice that the moving average line will be located below price movement. Here, the EMA line acts like a dynamic support. Whenever pullbacks (or short market reversal) occurs, don't quickly jump to perform a trade, rather wait and see if the price action will reject the MA line. Whenever a rejection occurs, the market corrects itself and continue in it's original trend. The point at which the price rejects the MA line and continues in it's uptrend movement is a good opportunity to perform a buy trade. This can be seen in the chart below.
From the chart above, we can see that the market is moving in an uptrend direction and this is confirmed by both the 100 SMA and the 20 EMA which are both below the price action line. Also, each time there is a major pullback, the price rejects the 20 EMA before it corrects itself. We can also see that these points where the price rejects the 20 EMA line is a good buy opportunity.
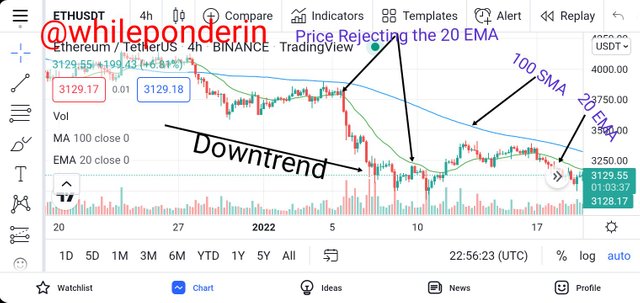
When using a moving average in a downtrend, you will notice that the moving average line will be located above the price movement. Whenever pullbacks (or short market reversal) occurs, don't quickly jump to perform a sell trade, rather wait and see if the price action will reject the MA line. Whenever a rejection occurs, the market corrects itself and continue in it's original trend. The point at which the price rejects the MA line and continues in it's downtrend movement is a good opportunity to perform a sell trade. This can be seen in the chart below.
From the chart above, we can see that the market is moving in a downtrend direction and this is confirmed by both the 100 SMA and the 20 EMA which are both above the price action line. Here, the EMA line acts like a dynamic resistance. Also, each time there is a major pullback, the price rejects the 20 EMA before it corrects itself. We can also see that this point where the price rejects the 20 EMA line is a good sell opportunity.
2. Moving Average, Resistance and Support Zones
We can also use moving averages along with Resistance and support levels in identifying the best points of entry and exist in a trade. It's best to combine the both, as it increases the accuracy level of the trade prediction. We know that normally, once the market gets to the support or resistance level, the market is tested, and depending on the reaction between the buyers and sellers, we either experience a market reversal or continuance of the current market trade.
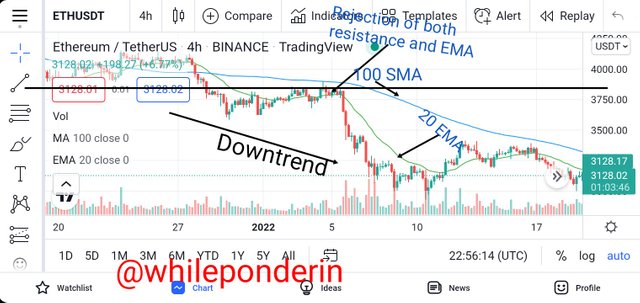
Depending on which occurs, we can decide which trade action we wish to perform. Adding moving averages to what we know about support and resistance levels can help us make better and accurate predictions as illustrated in the chart below.
From the chart above, we can see that the chart is moving in a downtrend. As soon as the price got the resistance level it is rejected. We can also see that the price also rejected the 20 EMA line. Thus, if we want to carry out a trade, based on the indications by both the 20 EMA line and the resistance level, we can perform a sell trade after the price closes below 20 EMA.
Question 4: WHAT DO YOU UNDERSTAND BY CROSSOVER? Explain in Your Own Words.
The moving average crossing is a kind of trading strategy which combines two moving averages which are set at two different periods with one of them having a low period setting while the other one will have a longer period setting.
Normally, when moving averages are set like this, we will notice that the one that has the lower period setting will be reacting faster than the one which has a longer period setting. By combining the two MAs, the trader can be able to identify clearly the best selling and buying opportunities available in the market.
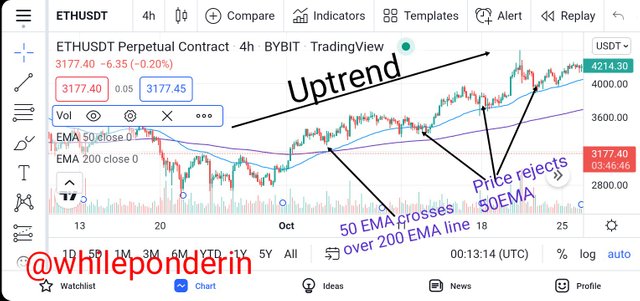
To example this further let's consider a chart with two EMAs see at periods of 50 and 200 respectively. Whenever the EMA with a lower period (50 in this case) crosses over above the EMA with a higher period setting (200 on this case), it is considered as a signal for uptrend movement. If after crossover has occurred and the price bouncing off the EMA (which at this point is acting as support), the indicator suggests that the position is a good to perform a buy trade. To illustrate this, lets consider the chart below:
From the chart, we can see that the 50 EMA line crosses above the 200 EMA line. This indicated that the market has began to move in an upwards direction. Also, after the price has rejected the 50 EMA (acting as dynamic support), we can see how profitable the buy trade would have been.
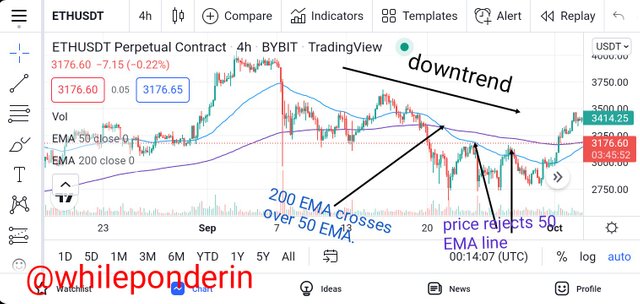
In the same manner, whenever the EMA with a higher period (200 in this case) crosses over above the EMA with a lower period setting (50 on this case), it is considered as a signal for downtrend movement. If after crossover has occurred and the price bouncing off the EMA (which at this point is acting as resistance), the indicator suggests that the position is a good to perform a sell trade. To illustrate this, lets consider the chart below:
From the chart, we can see that the 200 EMA line crosses above the 50 EMA line. This indicated that the market has began to move in a downward direction. Also, after the price has rejected the 50 EMA (acting as dynamic resistance), we can see how profitable the sell trade would have been.
Question 5: EXPLAIN THE LIMITATIONS OF MOVING AVERAGE.
Below are some of the limitations of moving averages:
1. Moving Average is a lagging Indicator:
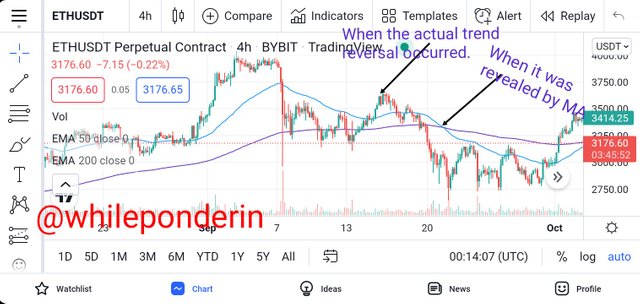
One of the limitations of moving average is that it is a lagging indicator. This implies that it uses mostly previous price movements in calculating itself. Thus, it has no implication on the current formation of price. This limitation makes it not a very useful indicator when carrying out active trades as by the time it may reveal the trade opportunity, it may be too late.
2. Trend based Indicator:
Moving averages are trend based indicators. This implies that it can only be used when the market is moving in an uptrend or downtrend movement. When the market is ranging, moving average have little or no use.
3. Calculation of Data
Each time a candle is closed, the data for moving average is recalculated. This constant recalculation results to continuous changes in the values of indicator. This may likely lead to the generation of distorted signals.
4. Rules for using Moving average
There are no specified rules when it comes to setting the period of a moving average. Since these periods are chosen arbitrarily, there is high chances that the indicator may likely be generating false trading signals.
Moving average indicator is basically a trend-based indicator which is obtained by calculating within a specific interval, the general average movement of price of an asset.
One of the importance of Moving Averages is that it gives us a clear indication of how the activities and how exactly the market is actually moving, thus enabling the trader eliminate the false signals in the chart.
Although it is a good indicator for forecasting the market, it has some limitations such as the fact it's a lagging and a trend-based indicator, as well as it's lack of specified rules when it comes to setting the period of a moving average.
This article was sponsored by My Recipe Checklist and Wealth Rector, you can also check out some of the best bars in Riverside if you are in the area
Thank you professor @shemul21 for this amazing lesson.

