
Hey guys,
I welcome you'll to the 5th week of the SteemitCryptoAcademy course by Professor @sapwood. In this course, I will run a comprehensive review on Onchain Metrics- Part 3.

Question (1)
What do you mean by Global In/Out of the Money? How is a cluster formed? Explain ITM, ATM OTM, etc with examples?
- Global In/Out of the Money(GIOM)
Over the years different on-chain metrics data services have developed and provided data of different cryptocurrencies based on their volume, price traded, and also the holders of a particular crypto asset. Users of these platforms have also sought to know the percentage of addresses are in profit or loss, this gives the user an idea of how many addresses purchased the currency early or late before its increase in value. The Global in and out of the money provides a clear data reference for this information.
GIOM/ Global in and out of the money is an on-chain mechanism that arranges the address of a crypto asset into clusters based on the volume and price range at the time of purchase. The price range is used to determine the average cost within that cluster.
Global in and out of the money on-chain data helps users to comprehend if the addresses in possession of a crypto asset are in profit or loss, but this data is based on a comparison between the current price and the average price of the cluster of addresses at which they were bought and held.
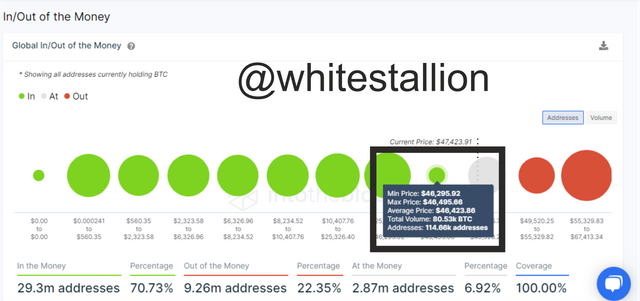
From the image above, the GIOM shows details of a Total volume of 80,53k BTC which is held by 144,66k addresses at an average price of $46.423 and a price range between $46,295 and $46,495.
- How is a cluster formed?
The cluster is formed based on the accumulation of multiple addresses which purchased a crypto asset at a very close price range within a given period, the cluster can then be categorized as an ITM or an OTM based on the Total volume size purchased within the given price range. the cluster can serve as support or resistance to the price action of BTC based on the size of its Total volume and also if it is an ITM or an OTM.
- Explain ITM, ATM OTM, etc with examples
GIOM on-chain data is made up of three categories which are
In the Money
At the Money
Out of the Money
In the Money(ITM)
This is a situation where the current price of a crypto asset is higher than the average price of a cluster. The ITM
can serve as a support for the price action but this will largely depend on the Total volume of the cluster, if it has a very large volume that is enough to have an impact on the market then it will be safe to say or predict that the price action will find it difficult to break the support.At the Money(ATM)
This occurs if the current price of the asset is equal to the average price of a particular cluster. This means that the current price is within the price range of that cluster, this could also be an area of breakeven.Out of the Money
This is when the current price of an asset is lower or less than the average price of a cluster. The OTM serves primarily as a resistance to the price action but this is dependent on the size of the Total volume of the cluster, if its Total volume is small then the resistance will be weak enough for the price to break above it and vice versa.
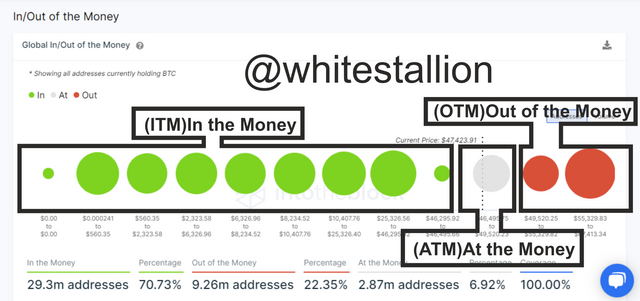
The image above shows the observable difference between the ITM, ATM and OTM. 29.3m addresses which are in possession of 13.99m BTC which is equal to $662.84b market cap are (ITM) In the money, While 9.26 million addresses which are in possession of 4.9m BTC which is equal to $231.96b market cap are (OTM) Out of the Money, also the (ATM) At the money have a holder address of 2.87million which are in possession of 1.44m BTC which is equal $68.04b market cap.
The image above also shows that the nearest (ITM) cluster to the price action of BTC/ current price has a very small volume, this means that the support the (ITM) carries is weak and the BTC price might likely go below the cluster average pice, thereby putting address within that cluster into the loss.

Question (2)
Explain about Large Transaction Volume indicator with examples? What is the difference between Total and Adjusted Large Transaction Volume?Examples?
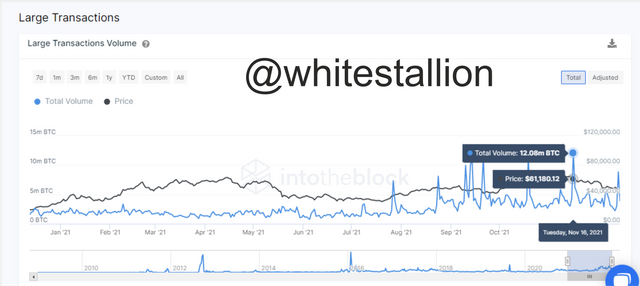
Large transaction volume is an on-chain metrics indicator that accumulates transactions that are over $100k worth in value, this means that all transactions that are over $100k in value are recorded and used to plot a graph to show the interests of the big players or large investors within a particular crypto asset, but sometimes this indicator could be misleading because an individual can use multiple addresses for a transaction which will still lead back to the originating address, that is where there is a Total and Adjusted Large Transaction Volume.
- What is the difference between Total and Adjusted Large Transaction Volume?
Total and Adjusted Large Transaction Volume are the categories used to differentiate the filtered and unfiltered large transaction volume. The Total Adjusted Large Volume is unfiltered because all the transactions are recorded without a cross-check of individuals using multiple addresses for transactions, while adjusted Large Transaction Volume is filtered, which means it will be less misleading after individuals using multiple addresses for a transaction have been filtered.
- Total Large Transaction Volume.
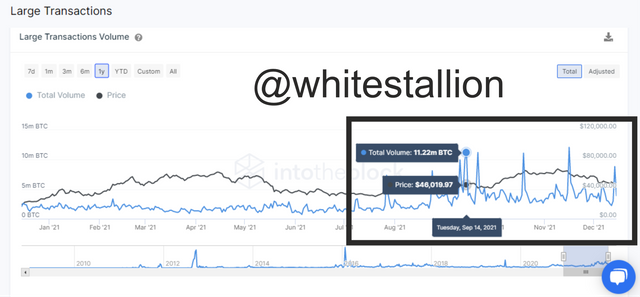

The image above shows the unfiltered accumulation of interest in BTC by the large or big players, the chart shows transactions that are over $100k, the interesting thing in this chart is that it shows that during the first bull run at the start of 2021, there was not much involvement of the big players, but towards the ending of August there was a huge increase in the volume of BTC traded over the value of $100k with its peak in trading volume reaching a high of 11.32 million BTC on September 14. But this chart is unfiltered which means it echoes so many irregularities in the chart readings due to individuals who use multiple addresses to carry out transactions that lead back to the original address.
- Adjusted Large Transaction Volume.
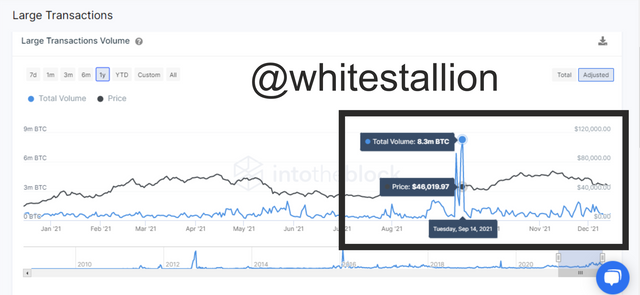

The image above shows the filtered chart of the transactions worth over $100k, the chart also shows the little interest of big players at the first bull run early in the year but also shows a huge spike in interest from the big players towards the ending of August, but it also reached a peak of 8.3 million BTC traded on September 14.
The major difference I noticed from the chart was that after the adjusted volume of interest by the big players I noticed that there was a huge drop in BTC interest after September, but this was not evident in the Total Large Transaction volume which echoed in the Traded volume increase peaking at a high of 12.08 million BTC on November 16, also the daily traded volume of both the Total and Adjusted Large Transaction volume shows readings of very far distinct values, with the Total Large Transaction volume showing readings of over 3.91 million BTC and the Adjusted Large Transaction Volume showing readings of 659.9k BTC, this shows that the Total Large Transaction Volume chart does not accurately denote the tone of the market because of its misleading readings.

Question (3)
Analyze a crypto asset(other than BTC) using on-chain metric: GIOM, and Adjusted Large Transaction Volume? Ascertain whether it supports a Bullish or Bearish bias or Neutral? How do you find the support and resistance using GIOM? How do you ascertain the upside/downside momentum using GIOM? Use the InTotheBlock app or any suitable app? (Examples/Screenshots)?
For this Task, I will be analysing the Ethereum crypto-asset using the Into the Block site.
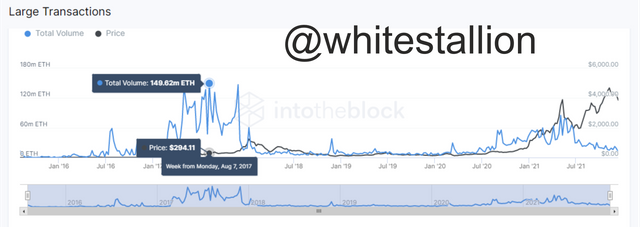
The Ethereum crypto asset was created in 2015 by a 19-year-old called Vitalik Buterin, at the time of development, the project and cryptocurrency were not yet popular in the world, but within the space of 2 years, large transaction volume peaked at a high of 149.62 million Ethereum within a price range of $50 to $800.
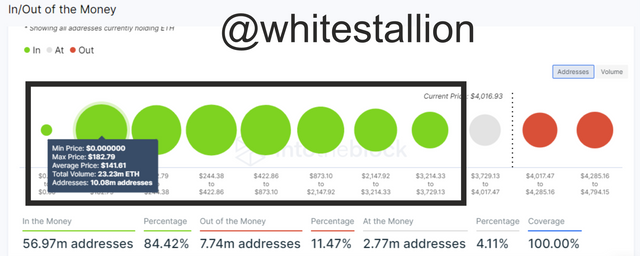
The GIOM on-chain metrics also show that the first four clusters with huge volumes of over 4 million Ethereum were purchased within the price range of $50 to $800, this shows that there was a huge influx of large investors towards the project within this period.
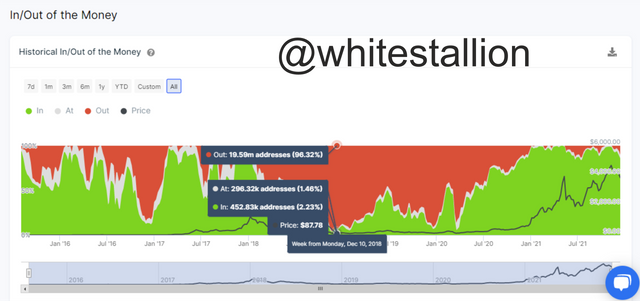
The Historical GIOM also shows a graphical reading of ITM and OTM momentum. the screenshot above indicates a zone where almost all the holder address in possession of Ethereum were Out of the Money(OTM). But looking at the initial chart of the Large Transaction volume I noticed that within this period there was a lack of interest from the big players because there was a huge reduction in the VOlume traded over that period that was over $100k in value.
- Ascertain whether it supports a Bullish or Bearish bias or Neutral
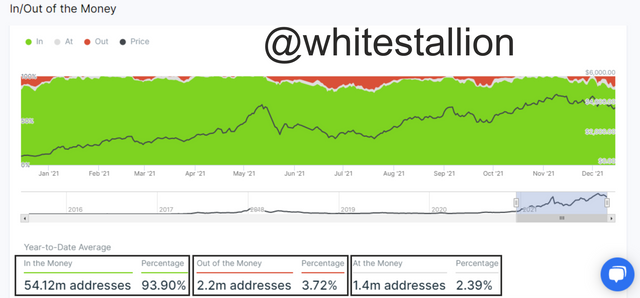
Looking at the Historical GIOM on-chain metrics data above it is clear that 54.12 million addresses currently in possession of the Ethereum coin are in profit, this is over 93.90% of all the holder addresses of the Ethereum coin, therefore it is safe to say that the GIOM supports a Bullish movement for the long term.
- How do you find the support and resistance using GIOM?
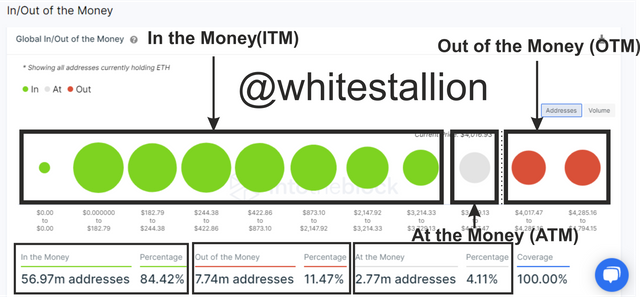
From the image above it is already clear to state that in the long term the GIOM stipulates that the market is controlled by the ITM or In the Money category because its holders are by a high percentage in much profit than the OTM.
The ITM or the In the Money serves as support to the price of Ethereum while the OTM or Out of the Money serves as the Resistance. For an ITM cluster to serve as strong support which would be able to hold off the price action from breaking below it, it has to have a relatively higher Volume than the ATM and OTM, this also goes for the OTM.
Therefore to find support the using the GIOM I have to check if the latest cluster of the ITM has a higher volume than the ATM and OTM and if it does then it should serve as a strong support to the price action.
Also to find the resistance I have to identify that the latest cluster of the OTM has a higher volume of holder addresses in less than the ATM and ITM, thereby creating a strong resistance for the price to bounce back.
- How do you ascertain the upside/downside momentum using GIOM
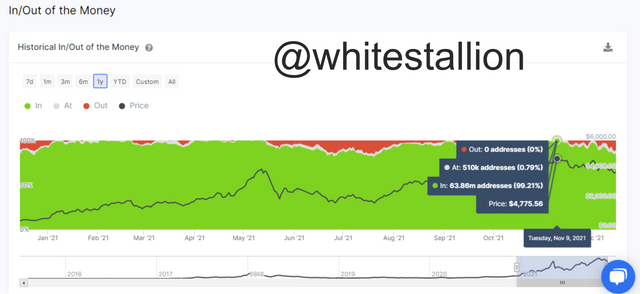
Looking at the Historical chart of the GIOM above, it identifies that from early October to Mid-November, the driving momentum was the upside or Bullish trend, because specifically on November 9th 99.21% of the Ethereum holder address were in profit.
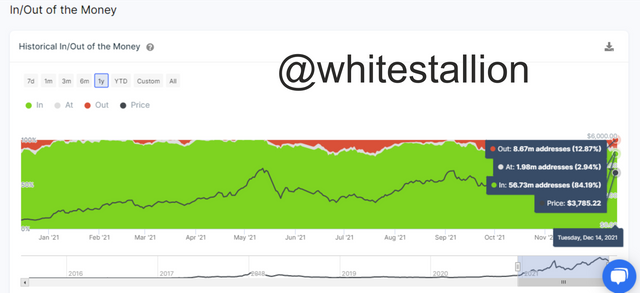
Likewise taking a look at the current GIOM price indication, it shows that there has been a little shift of holder address in profit back to the loss zone, this is probably as a result of ITM clusters not having enough volume to serve as a support for the price action to bounce off it.

Conclusion
The GLobal in and Out metrics indicator is very helpful in identifying when the big players are getting involved with the market, this helps other small scale investors know when to key in or exit the market because most times that there has been very small involvement of large scale investors there is always a possibility of a crash or decrease in value of the underlying asset.
While using the Large Transaction Volume metrics indicator it is safer to use the Adjusted Large Transaction Volume chart, by doing so the user will not be misled into getting involved with the market when the big players are not involved due to false readings of the Total Large Transaction Volume chart.
Thank you Professor @sapwood for this insightful lecture.