This should be my first homework to be done from @stream4u, and I hope to carefully attend to each question to the best of my understanding.
These are the homework task below for week-4.
Homework Task(Topic 1): What Is The Meaning Of Support Can Become Resistance & Resistance Become Support, When and Where set Buy trade, Chart Example?
Homework Task(Topic 2): What Is A Technical Indicator? (You can explore it as much as you can, like explain its role, show anyone technical indicator from your chart and name of that Indicator.?)
Homework Task(Topic 3): Provide your view and explore TradingView.
Homework Task(Topic 4): What is 200 Moving Average, how and when we can trade/invest with the help of 200 Moving Average? Show different price reactions towards 200 Moving Average
WHAT IS THE MEANING OF SUPPORT CAN BECOME RESISTANCE & RESISTANCE BECOME SUPPORT, WHEN AND WHERE SET BUY TRADE, CHART EXAMPLE?
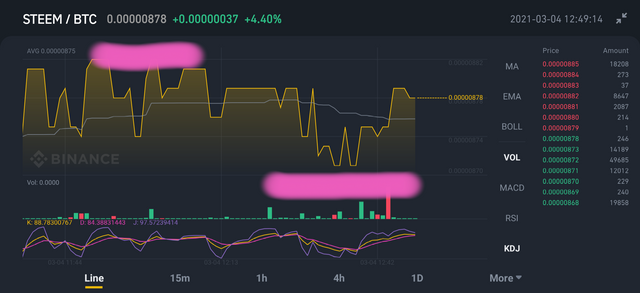
Basically , support and resistance in crypto trading are essential trading tools which guide the trader or investor on when and how to buy in and sell out during market volatility. An understanding of this charts would either make the investor make gains or marginal loss as the case maybe.
(Screenshots)
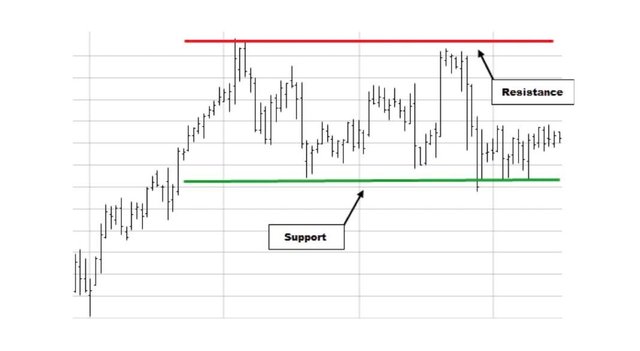
Both Support and resistance in the charts are price points that influences buying and selling activities. While Support is the price level which an assets stops falling, Resistance is the price level which and assets stops rising. It is of smart thinking that a soon as the investor/traders notices the price support, he should be able to buy in immediately before or when the price starts going up. Also, for resistance, as soon as it is identified, the trader can also initiate selling activities.
With the above Understanding of both parameters and trading tools, Support may be seen to act as resistance When the price of an assets is seen to go down beyond the initially drawn support line (hence creating a new and second support line), but finds it difficult to rise about the ist first support line... We can now say SUPPORT HAS BECOME RESISTANCE.
This is no difference for when RESISTANCE BECOMES SUPPORT. When the price of an assets breaks upward beyond the initially created resistance line and hence creating a new price resistance but the price of this assets is unable to drop below the initial price resistance, we can say RESISTANCE HAS BECOME SUPPORT.
WHAT IS A TECHNICAL INDICATOR? (You can explore it as much as you can, like explain its role, show anyone technical indicator from your chart and name of that Indicator.?)
Technical indicators are trading tools used by traders to gain insigt on demand and supply of assets as it affects trading in the market. These are technical analysis that determine price behavior of traded assets. There are some metrics that are considered to make a good technical analysis which may include; metrics , trading volume, price history etc. Indicators are most important in generating buying and selling signals.
Technical indicators also uses overlays; where same scale as prices are plotted over the top of the prices on a stock chart. Examples are the Bollinger Bands. Also is the use of oscillators where prices oscillate between a local minimum and maximum are plotted above or below a price chart. Examples include the stochastic oscillator, MACD or RSI.
Other indicators used by traders may also include the following;
ON-BALANCE VOLUME
On-Balance Volume indicator (OBV) enables the trader to measure the flow of volume in a security over a period of time. This flow of volume maybe positive or negative. When the prices rallies up and moves upward, this is regarded as been positive while download price movements indicates its negativity. With this tool, each days volume is ascertained by calculating the total volume up and down.
When OBV is on the rise, it simply shows that there are buy in which are the likely factors that drive price upward movements while a decline in OBV split shows that there are more sellers than buyers.
ACCUMULATION/DISTRIBUTION LINE
This indicator is used to show money inflow and outflow in a given security. This indicator does not only captures the closing price of an asset buy all also it's trending range over a period of time. When there's an UPTREND it shows there are buying interest in the market, but when there DOWNTREND this also shows selling interest with low buying interest.
Moreso, this indicator also keep tracks of divergence. For example, if the indicator starts falling while there's a price rise, there's every likelihood the price would reverse. When the indicator starts rising while price decreases, it shows that's every possibility that prices would go higher.
AVERAGE DIRECTIONAL INDEX
This is a trend that indicates the shoes the strength and momentum of a trend in a market.when the Average Directional Index is above 40, it simply shows that there's a positive or stronger strength and momentum of the trend. Average Directional Index with less than 20 mark simply shows the trend is considered weak or non-trending.
AROON INDICATOR
This technical indicator is used to measure if there's a security in a trend, and most especially identifies when a new trend is set to start up in the trade. It displays and indicator line in the charts known as Aroon up-line and Aroon down-line which tells us when there's and Uptrend or Downtrend.
PROVIDE YOUR VIEW AND EXPLORE TRADINGVIEW.
This is a chatting platform that allow investors and traders to access the price behavior of an asset in a glance. It showcases the real time price movements of a given asset in a trade hence the need to make a decision to either buy in or sell off. It is a widely adopted chart view by technical analyst due to its wide range availability of technical indicators geared towards reading the financial market.
TRADINGVIEW also comes in an App form which can be downloaded over the stores (Playstore or Appstore). As soon as this is done even without putting in your profile, this is interface that pops up immediately.
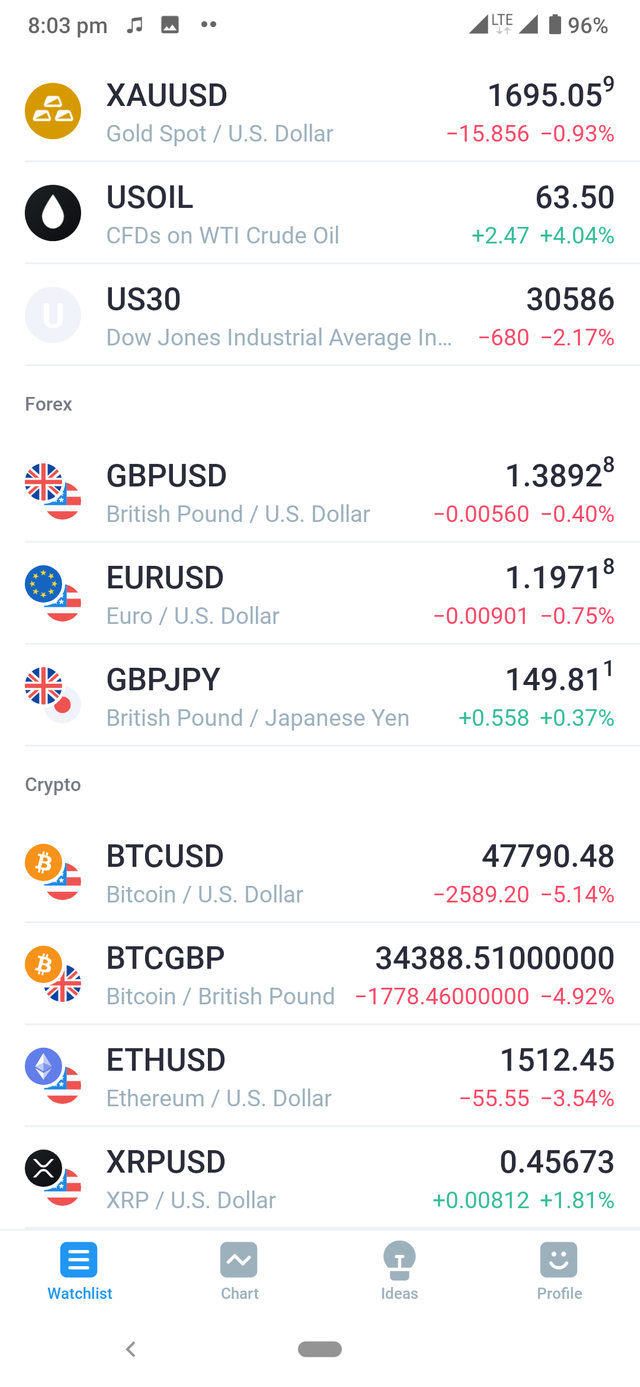
This interface displays the different trading pairs for us to make our choice. When you click on the second icon next to watchlists which is Charts, this is what the interface looks like in the image below;
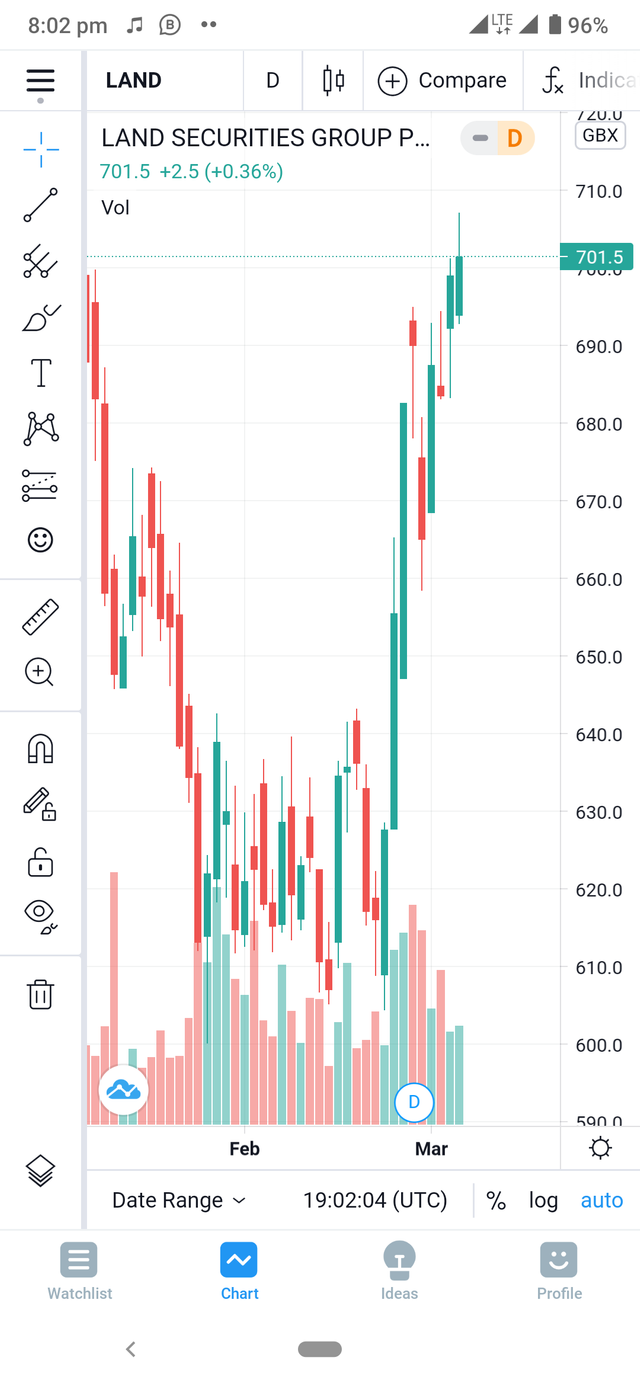
From the image below showing the charts, we can see the multiple indicators for investors to harness. At the top of the chart, we can also see it's trends have security. We can also vividly see the support and resistance points at 605 and 701.5 respectively.
What is 200 Moving Average, how and when we can trade/invest with the help of 200 Moving Average? Show different price reactions towards 200 Moving Average
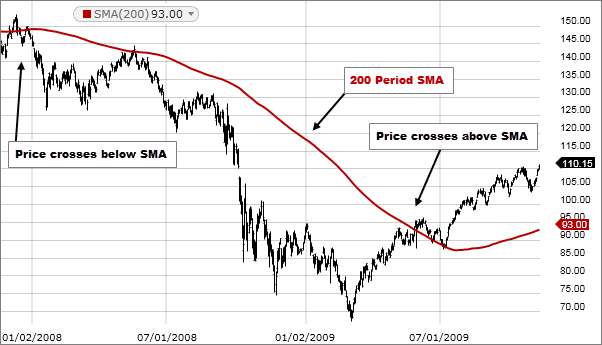
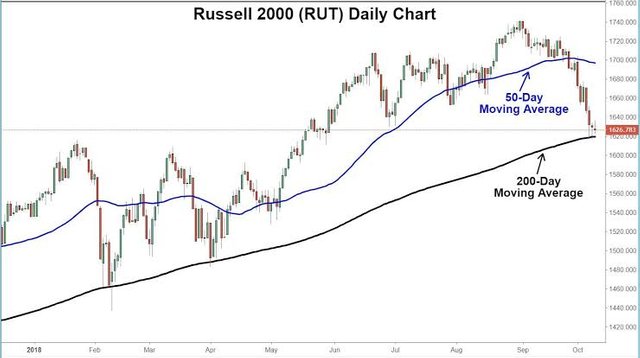
This is also a technical indicator used for long term tracking of trades. Trades can be certainly determined on the long term basis. It has a tool to determine when price is above or below the 200 day moving average indicator. When price is above the 200 day moving average indicator, then the investor/trader should buy in but when price is below it, it is best deal to sell off.
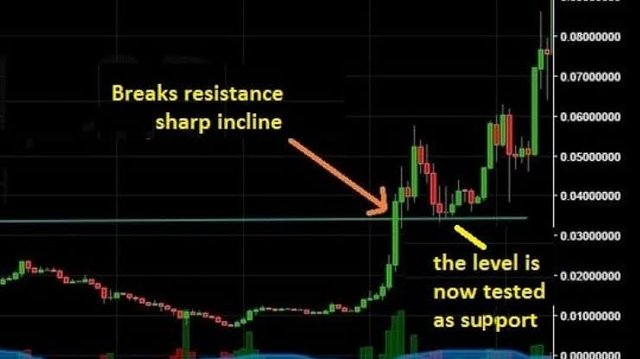
This tool is seen to represent as a line in chat that indicates the average price over the past 200days or 40weeks. It gives an insight if a trade has been in Uptrend or Downtrend form by also identifying it's support and resistance.
This are charts all showing when 200 Moving Average is lower and higher the price .
@stream4u, this is my entry for this homework week4 task. Thanks everyone that goes through my post.
Special regards;
Cc: @steemcurator01
Cc: @steemcurator02
Cc: @steemitblog
.jpeg)
.png)
.jpeg)
Hi @xkool24
Thank you for joining Steemit Crypto Academy and participated in the Homework Task 4.
Your Homework task 4 verification has been done by @Stream4u.
Thank You.
@stream4u
Crypto Professors : Steemit Crypto Academy
Downvoting a post can decrease pending rewards and make it less visible. Common reasons:
Submit
Alright,I will implement that immediately. Thank you for the review
Downvoting a post can decrease pending rewards and make it less visible. Common reasons:
Submit