It is another welcome to all of my fellow steemian to this season 4 week 2 class that seeks to explore Trading Indicator delivered by professor @reminiscence01. I must state that the lecture is explicit. I will be answering the questions one after another so, let's kick-off.


1a) In your own words, explain Technical indicators and why it is a good technical analysis tool.
Trading is like a coin that has two sides, profit, and loss. As a trader, you are optimistic about profit yet take every necessary step to avoid or at most minimize loss. The past could work with the present given the future, thus a trader will need to explore the past, analyze the present to be able to have a clue of the future, or carry out a forecast. To this effect, success in trading will be influenced by the understanding and utilization of technical indicators as it creates a link between the past, present, and future.
Since the past market price trend must be studied and the present analyzed about the future, any calculative graphical presentation that considers the past market price trend, analyzing the present price to assist in predicting the future can be referred to as technical indicator.
The major items used in the formation of the technical indicator are price data and time. In the formation, you take cognizance of the price (previous closing/opening) of an asset over some time.
The market is not without fluctuations as such forecasting or prediction is paramount without which trading would be difficult trade. Carrying out analysis based on this market uncertainty would only be possible with technical indicators. Therefore, there is no doubt that technical indicator is a very important and good tool that facilitate trade to carry out market price analysis to maximize investment.

1b) Are technical indicators good for cryptocurrency analysis? Explain your answer.
A technical indicator is not just good but also a necessity as long as cryptocurrency analysis is concerned. First, the market trend cannot be understood without an analysis which can only be done using technical indicators. Cryptocurrency analysis is very important as prices of assets increase and falls therefore, to be able to study and have a good understanding of the movement of the market and make a good trading decision the technical indicator is needed.
There is no guarantee of asset price as the price of assets rises and falls there creating uncertainty on the side of the traders. Notwithstanding, trading must go on irrespective of these price fluctuations. The use of technical indicators will facilitate a trader to analyze this movement in price and to know when to make a purchase or sell.
Another area in which technical indicators are good for cryptocurrency analysis is in determining how far the price of assets has risen. As stated earlier, the price of assets is not guaranteed as it rises and falls. In other to ascertain how far it has risen or fallen, a technical indicator will be needed.
To this end, the technical indicator has been to be a very good and useful tool for cryptocurrency analysis however, for a good level of accuracy, other tools for technical analysis should be used along with technical indicators.

1c) Illustrate how to add indicators on the chart and also how to configure them. (Screenshot needed).
I will be doing the illustrations using TradingView Mobile App and adding Relative Strength Index (RSI)
Step 1:
Open The TradingView App or navigate to tradingview
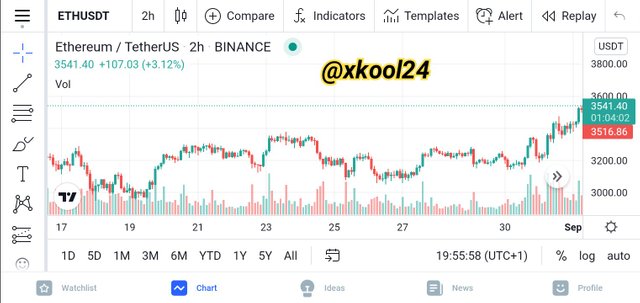 Landing Page

Step 2
Click on the coin pair area to add your desired pair. On the next page, input your choice of coin pair on the search box and select the pair on display. For this lesson, I will be using Ethereum/U.S. Dollar(ETH/USD)
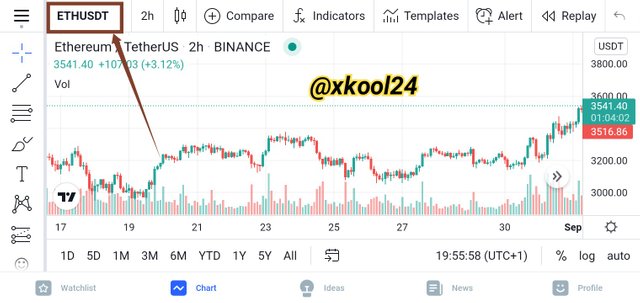
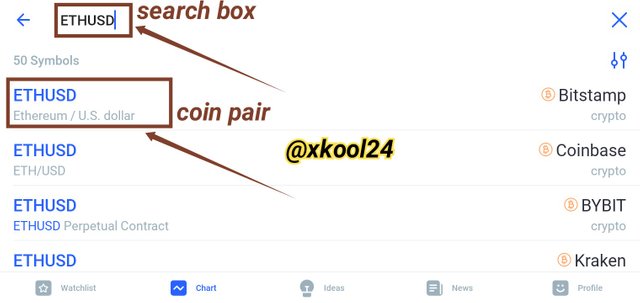

Step 3: After selecting your coin pair, the coin pair chat opens, click on fx Indicators to choose which indicator you wish to add. I will be selecting RSI for this lesson.
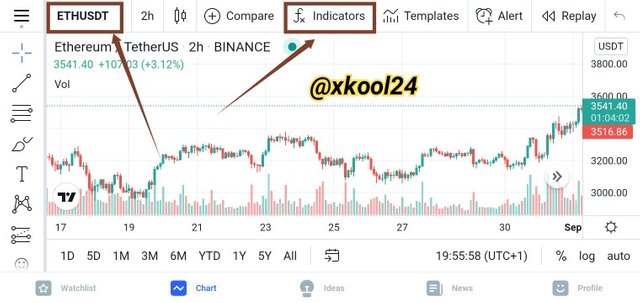
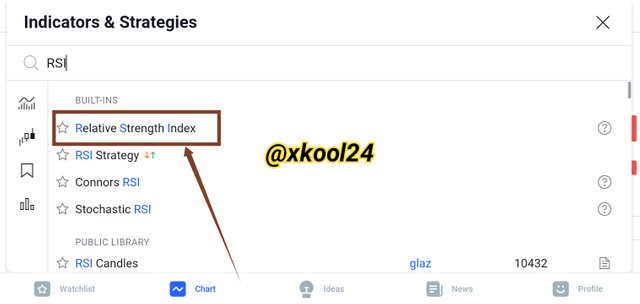
Step 4: On clicking the fx Indicator, a list of tools comes select Relative Strength Index
The RSI is added to the chart. The colour is seen to be mauve
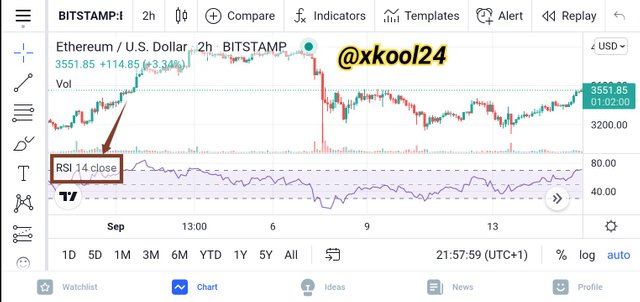

Configuring The RSI
To configure or format the RSI, click the RSI area
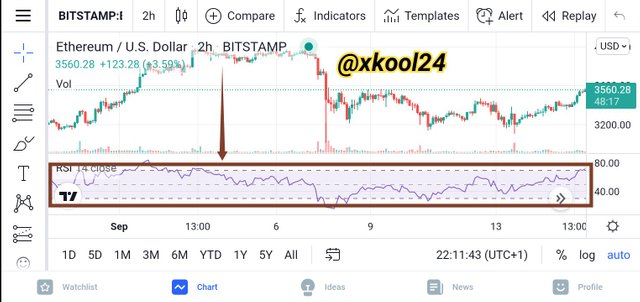
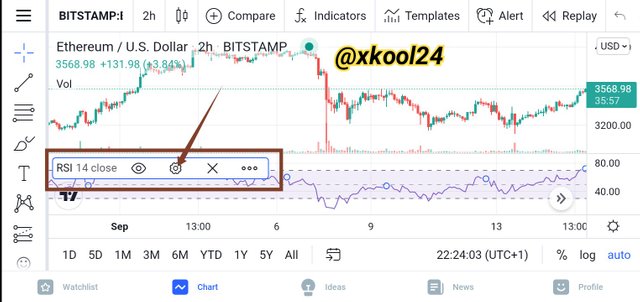
On clicking the RSI area, a rectangular box containing some icons is displayed. Click on the settings icon to lunch the formating interface
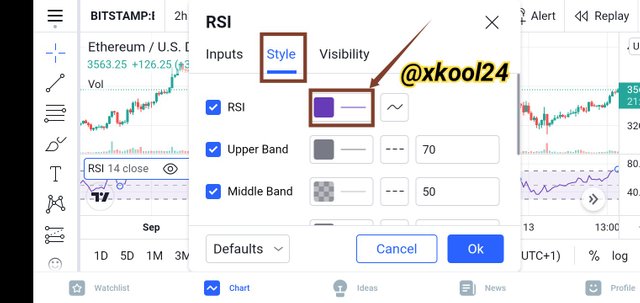
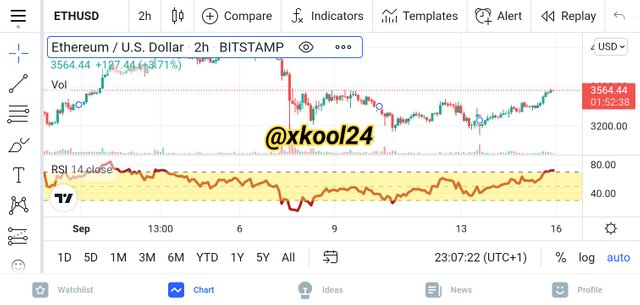
The formating interface is displayed(as shown below) where you can format the Input, Style, or Visibility. For this section, and the limit of my knowledge, I will only be changing the *** colour ***, thickness, and background of the RSI which are all found under Style.
To change the colour, click on the mauve colour box to open a colour palette and choose another colour of your choice.
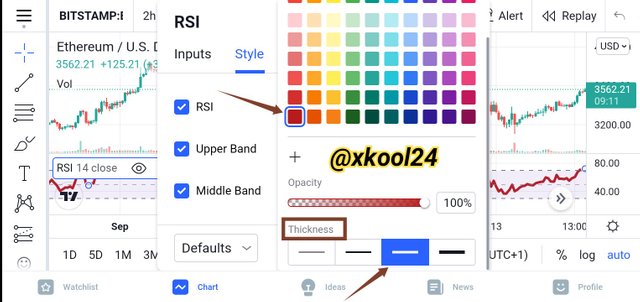
From the colour palette, choose your preferred colour. I will be choosing Red
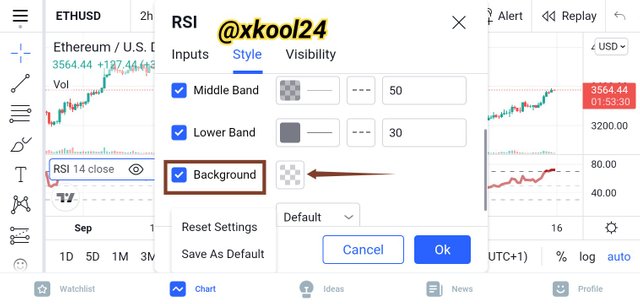
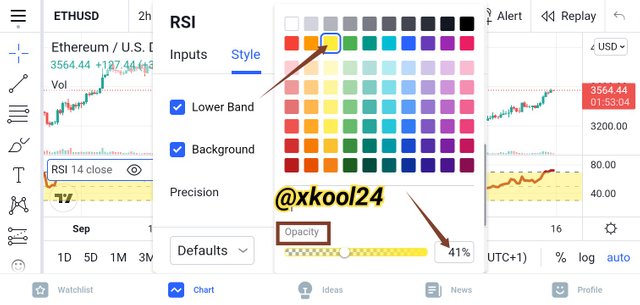
Going back to Background, I click on the background colour to open the colour palette from which I colour (Yellow) and adjusted the opacity to 41%
Formating completed:
Before
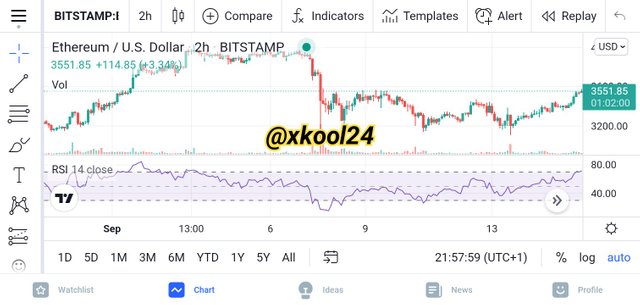
After
All screenshots are taken from TradingView App

2 a) Explain the different categories of Technical indicators and give an example of each category. Also, show the indicators used as an example on your chart. (Screenshot needed).
As explained by professor @reminiscence01 in the course of the lesson, there are three (3) classes of indicators which are:
Trend Indicators
Volatility Indicators and
Momentum Indicators
- Trend Indicators
The trend indicator is one of the vital indicators and as implied by the name, is an indicator that specifically helps trader traders to discern the direction to which the market is moving, if indeed there is a trend. Trend indicator aids easy identification of change in the trade as they move like a wave between high values and low values. The trend indicator is a guideline to traders that helps them trade in line with the market movement or trend.
Ichimoku Kinko Hyo, Moving Averages, Average Directional Index (ADX), Parabolic SAR etc are examples of Trend indicators.
Example of Average Directional Index (ADX) Indicator on a chart
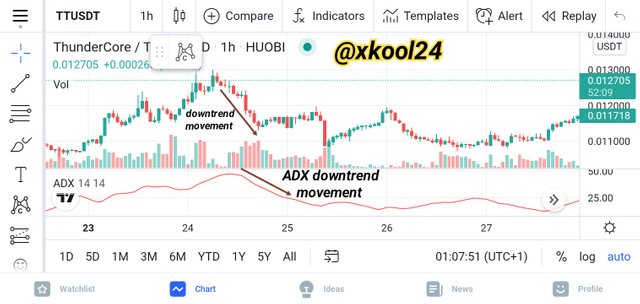
Average Directional Index (ADX) Indicator: TT/USDT chart
Screenshot taken from TradingView App

- Volatility Indicators
The movement of the market is not static, it is always fluctuating, making swings either up or down which is referred to as volatility. Volatility is one important part of the without which maximizing profits would be the difficult reason being that there must be a move of price traders to make profits. Consequently, volatility indicators show the amount of change in price in a given time.
Bollinger Bands, Average True Range (ATR) are examples of Volatility indicators among many others.
Example of Bollinger Bands indicator on a chart.
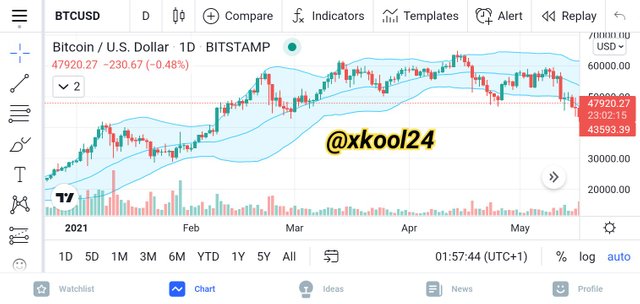
Bollinger Band Indicator: BTC/USD Chart
Screenshot taken from TradingView App

- Momentum Indicators
Momentum plies the ability of anything to maintain and resist any change to its consistent movement. Consequently, momentum indicator is another class of indicators that shows the strength of trend as well as indicate the probability of reversal occurring. Momentum indicators can be useful in ascertaining the distance travelled by the price of an asset and picking out tops and bottoms of price.
Relative Strength Index (RSI), Ichimoku Kinko Hyo, Stochastic, and Average Directional Index (ADX) are examples of Momentum indicators.
Example of relative strength index on a chart.
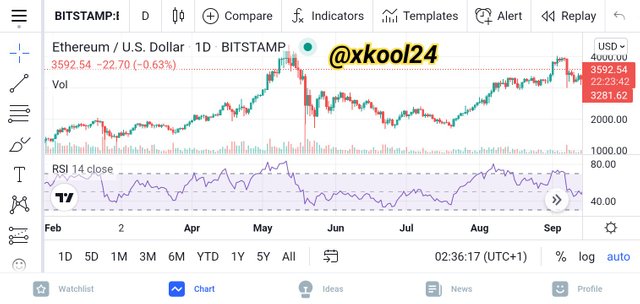
RSI Indicator: ETH/USD Chart
Screenshot taken from TradingView App

< center>2b) Briefly explain the reason why indicators are not advisable to be used as a standalone tool for technical analysis.
Validity and accuracy are the watchwords for traders because no one wants to make a loss rather, profit. The higher the number of indicators, the higher the accuracy level.
Indicators are not advisable to be used as a standalone reason being that their level of accuracy may not be reliable as they may give false signals thereby misguiding a trader.
Since cryptocurrency demands the use of indicators is requisite and to be more efficient, reliable and accurate it is necessary, advisable and reliable if used along with two or more tools for technical analysis.

< centre>2c) Explain how an investor can increase the success rate of a technical indicator signal.
As earlier stated, technical indicators should not be used as a stand-alone tool as a result of the unreliability of the signal. It tends to offer false signals if used alone. The rate of accuracy and success of technical indicators is dependent on being used along with other tools for technical analysis which will also influence raise the trader's success rate.
Consequently, to increase the success rate of a technical indicator, it should be used in combination with other tools for technical analysis to improve accuracy and mitigate the level of false indications.

< centre>Conclusion
The lesson is so explicit such that technical indicator has been expounded as well its various categories. In addition, the effects of using a technical indicator as a stand-alone tool as well as the possible ways of improving its success rate have been explained too. For reliability and accuracy of the technical indicator, it should be used in combination with other tools for technical analysis.

Thanks to professor @sapwood for broadening my horizon on the importance of technical indicators.
https://steemit.com/hive-172186/@rocknrule111/basic-security-on-steem-achievement2-by-rocknrule
Please you verified me but no curation
My post will expire soon
Thanks
Downvoting a post can decrease pending rewards and make it less visible. Common reasons:
Submit