Hello Steemian,
This Homework post is of course 4th provided by @stream4u.
In this post, I will be sharing my thoughts on Support & Resistance, Technical Indicator and, 200 Moving Average.
I hope you will get some valuable information from this post.
Lets Began...
 Thumbnail created on snappa.com
🔴 What Is The Meaning Of Support Can Become Resistance & Resistance Become Support, When and Where set Buy trade, Chart Example?
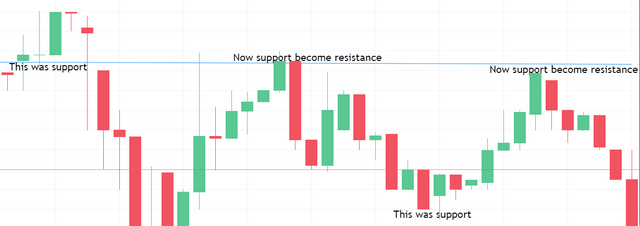
✔️ The below screenshot will help us to understand how support become resistance
 Support Can Become Resistance Image Source
✔️ In market there is no guarantee that support will be always support and resistance can't change, In the running market support can become resistance and resistance can become support any point of time.
✔️ If the pricing of an asset trends going downwards then there are chances that the support will become resistance in the coming few days, This trend can be found on the 15 M or 1 H charts.
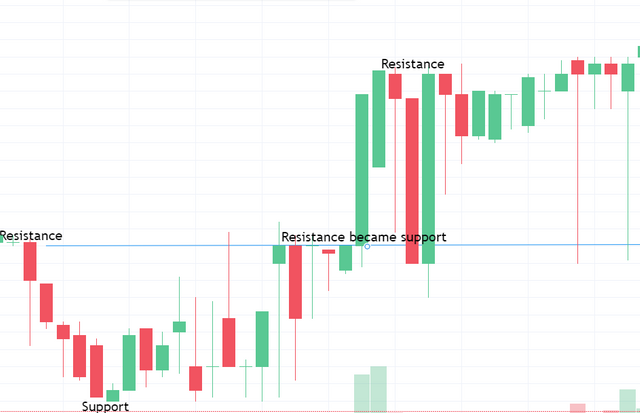 Image Source
✔️ In the above screenshot we can see how resistance become support, this happened because the asset value was continuously growing up day by day. This trend also know as bullish trend where a asset value touches a new height as compared to the previous chart and patterns.
✔️The best time to buy any asset is when the price of the asset reaches to the support point but always keep in mind when a asset breaks resistance and reaches higher point then don't wait for the asset to reach to the old support point, because in this case the resistance becomes the support and in this scenario best time to make an order is when its breaks its resistance.

🔴 What Is A Technical Indicator? (You can explore it as much as you can, like explain its role, show anyone technical indicator from your chart and name of that Indicator.?)
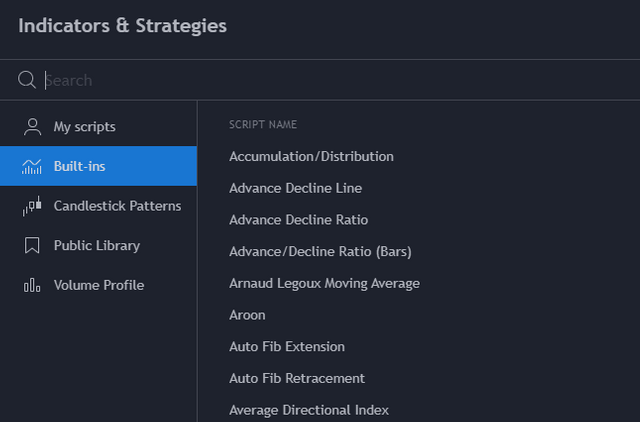
✔️ Technical indicators are patterns based signals which are based on a long research and price as well as volume, This indicator indicates the upcoming trends and it also help trader to under when to enter into the market and when to take exist from the market.
 Technical Indicators Image Source
✔️ The above screenshot is taken from TradingView and in the screenshot trader can find all the Indicators which will help them to understand the upcoming trends in the market, There several types of indicators which are introduced years by years by a deep research.
✔️ Indicators does not promise any trend it suggests as per there research and a long experience, before using indicators traders needs to go through the understanding process properly or it may lead to loss while trading.

🔴 Provide your view and explore TradingView.
✔️ Exploring tradingview, The word itself tell us that it is going to show us the trading view means how the market is going up's and downs, It will be creating an graphic pattern to help traders to better understand the market.
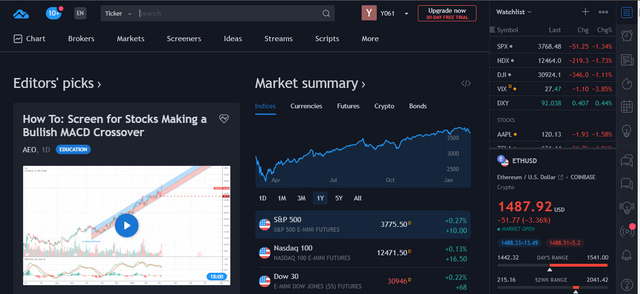 TradingView Image Source
✔️ Trading View is a platform which includes all types of currency in it like stocks, forex, crypto. Trading view platform give several features to customize the chart as per traders requirements.
✔️ Traders can create there own account without paying any single penny and they will get a wide range of tool that can help them to trade effectively and earn profit from the market.
✔️ In tradingview traders can select different types of currency in there watchlist from there they are one click away from the there trading currencies. It also allow traders to use built-in indicators as per there needs to achieve more growth form the market.

🔴 What is 200 Moving Average, how and when we can trade/invest with the help of 200 Moving Average? Show different price reactions towards 200 Moving Average
✔️ 200 Moving average is an indicators which is been used on a wide range by the traders, 200 Moving average is an technical indicator tools which is been used for long term investment.
✔️ By applying 200 moving average it calculates by using the below given formula:
- 200 Day Moving Average Formula = [(Day 1 + Day 2 …. + Day 200)/200]
✔️ Trader can apply 200 Moving Average on any currency help we can get an idea weather the chosen asset is going perform well or not, Traders gets an hint before investing into the market by using this technical indicator.
✔️ The below image shows us the upwards trends of the asset by 200 moving average.
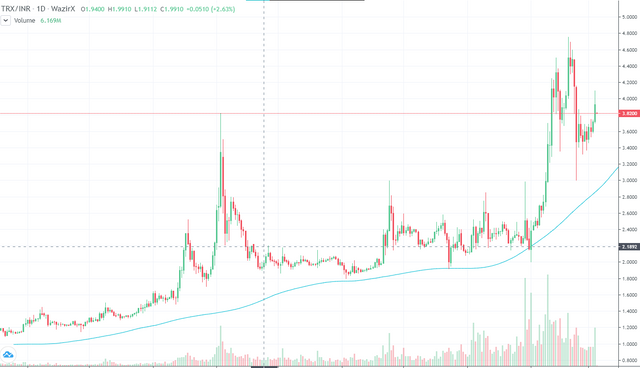 Upwards trends by 200 moving average
✔️ The blue line in the above image shows the 200 moving average, This image helps traders to identify the trends which is moving upwards.
✔️ The below image shows us the downwards trends of the asset by 200 moving average.
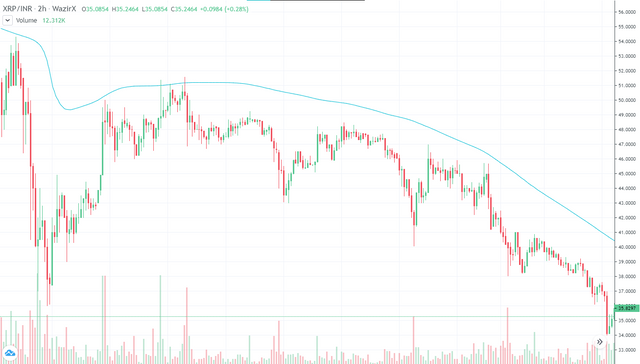 Downwards trends by 200 moving average
✔️ The blue line in the above image shows the 200 moving average, This image helps traders to identify the trends which is moving downwards.
✔️ The below image shows us the trends holding the support line of the asset by 200 moving average.
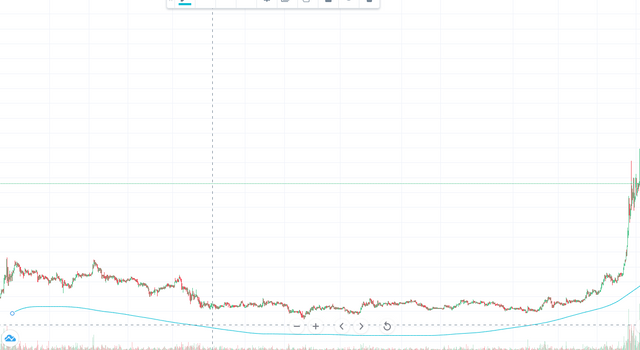 Trend holding support line by 200 moving average
✔️ The blue line in the above image shows the 200 moving average, This image helps traders to identify the trends which is holding the support line.


Cheers🍻
Let's Connect👉 @y0gi😁
Steeming India Community (Member)
Thank You for reading my post
✅My posts & comments are set to power up to 💯%. Your contribution would be very much appreciated.

🤩 Excited to see your positive comments.

#crypto200 #stream4u-week4 #steemitcryptoacademy #india #steemexclusive #steemit
Hi @y0gi
Thank you for joining Steemit Crypto Academy and participating in the Homework Task 4.
Your Homework task 4 verification has been done by @Stream4u.
Thank You.
@stream4u
Crypto Professors : Steemit Crypto Academy
Downvoting a post can decrease pending rewards and make it less visible. Common reasons:
Submit
Thank You @stream4u,
Thank You for your remark
🍻Cheers
Lets Connect👉🏻@y0gi
Steeming India Community: (Member)
#india #steemit #crypto #Steem #academy
Downvoting a post can decrease pending rewards and make it less visible. Common reasons:
Submit