Greetings to all my fellow Steemians. this is me @yarhassan. today, I learn a new topic which is the Ichimoku-Kinko-Hyo indicator. this indicator is very helpful for the new traders. I have some previous knowledge about this indicator but after reading this post. my knowledge is increasing. so, let's get started with today article:

Analyze your understanding of Kumo, as well as your two lines.
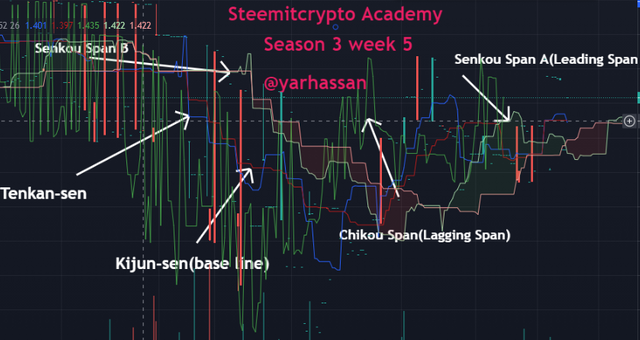
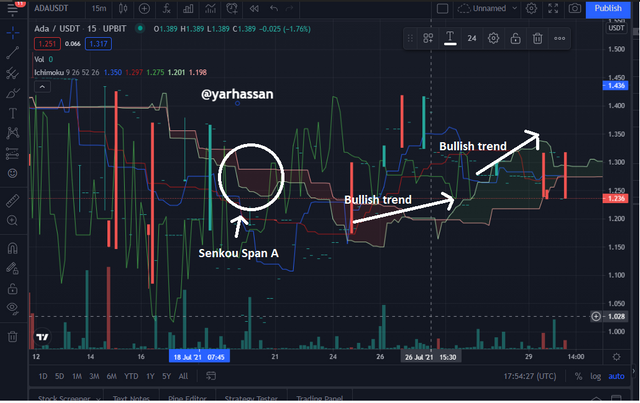
Kumo cloud is made up of 5 lines. in these five lines, we analyze the behavior of the market. I will show the chart of Ada/usdt. so, you will understand better.
basically, the Kumo is the cloud in this cloud the doted line exists. between these dotted lines, there are two lines first is Senkou span line A and the second is Senkou span line B. under these two lines we will predict the price of the market. I will discuss these two lines one by one in detail.
Senkou Span A:
this span indicates the sign of a bullish market trend because the Senkou span A contains the previous market data. therefore, it is also called the leading span. this span predicts the market based on previous data. if you want to draw span A you need 26 dotted plots. which is very helpful to predict the Support and resistance levels in the future.
when you combine the Senkou A with Senkou B. so it forms the Kumo cloud. this cloud shows its power under the support or the resistance. if the price shows above the cloud then it means it is a support level. and if a price shows below the level of the cloud. so, it means that this level is resistance level.
Senkou Span B:
span B is slower than the A. the reason for slow speed is because span B is calculated the 52 periods of data. which is double as compare to span A. when we talk about the behavior of Span B so, it shows the bearish price trend. span A is used for the short term prices and span B shows the long term prices.
The formula of Span B:
Senkou Span B= 52 Period High+ 52 Period Low / 2
The span B shows the resistance level. see in the graph:

What is the relationship between this cloud and the price movement? And how do you determine resistance and support levels using Kumo? (Screenshot required)
if we talk about the relationship between the Kumo cloud and the price movement. so, in between these two terms a good relationship exists.
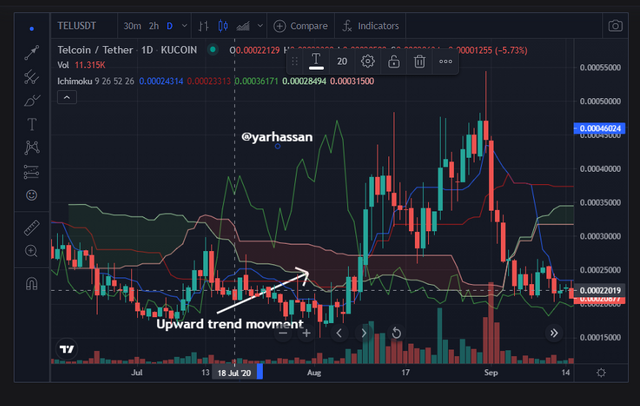
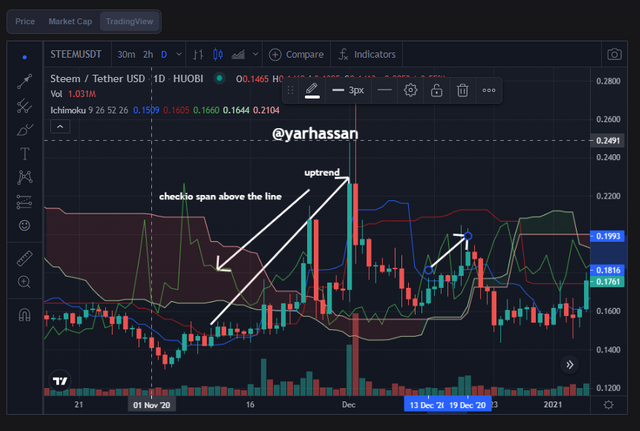
In such a case when the Kumo cloud is in an uptrend phase. so, it means the price shows upward and the green cloud is also moving in upward. this is the sign of the bullish market trend. this is a good sign for traders to take their position and start buying. see the graph.
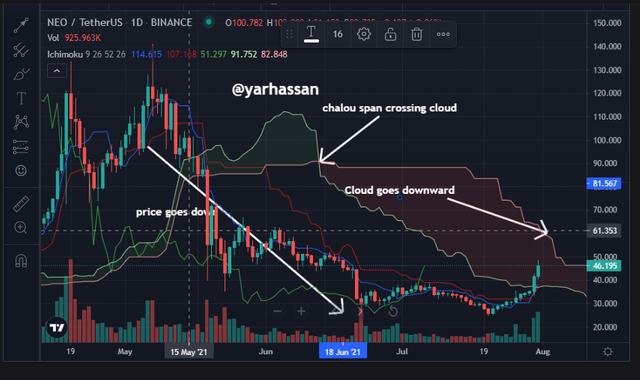
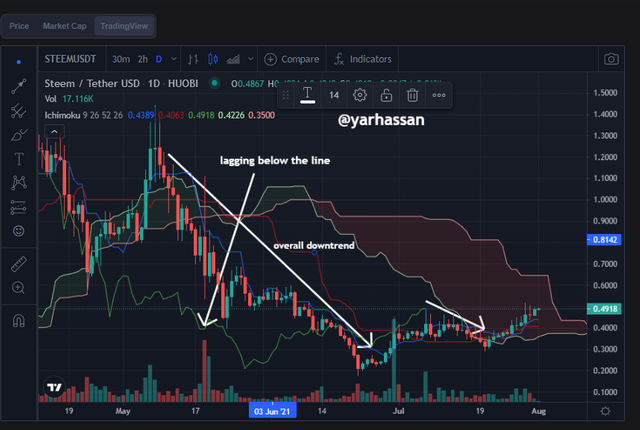
When you see the cloud above the price pattern. so, it is an alarming situation to the trader. trader starts sell their portfolio. this situation is known as a dumping situation. I will show you the graph.

How do you determine resistance and support levels using Kumo?
As we all know that the Kumo cloud is not easy to understand. but on other hand, it is very simple in terms of implementation. but if we talk about traditional resistance and support. so, it is very easy to understand and if you implement this traditional resistance level so, its implementation is quite difficult.
In this answer, I will be focusing on Kumo cloud resistance and support levels. and how we will determine it. In Kumo cloud, there are two types of span A or span B. these two spans are interrelated to each other. in the previous question, I will discuss it if span A is above span B it shows the Upward direction trend. and if Span A is below Span B. so, it will show the downward direction trend. so, what does it means? simply means that these two trends also affect Resistance and Support.
if the space between the cloud becomes larger so, it means it has strong resistance and support. no matter either the whatever the situation means downward or upward.
and in such a case if the space between the clouds is smaller so, it will create an effect in the market and this is the situation in which trader becomes confused because of the smaller cloud. we couldn't determine the price pattern in terms of upward or downward.

How and why is the twist formed? And once we've "seen" the twist, how do we use it in our trading?
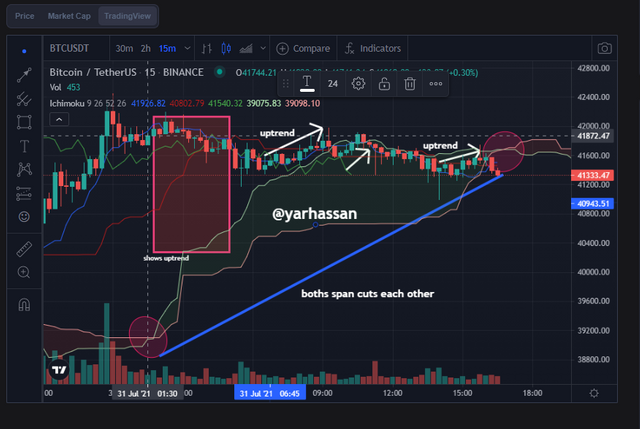
Twist this keyword is very very important in the Kumo cloud. because the twist changes the price pattern. sometimes twist changes the price pattern to upward and some time this twist pattern also changes the price pattern to downward. so, here one question is raised which is the formation of twists. as I early discuss in the previous question that there are two spans that exist in Kumo cloud which are Span A and Span B. and these both spans create the twist. when Span A line meets with Span B line and becomes flat each other so, in the result, they formed the twist.
When Kumo Bullish twists occur:
this twist occurs when the span A cuts span B. so, in this case, we start the trade and buying the crypto because it is golden time. when the market is in an upward direction.
When Kumo bearish twists occur:
this twist occurs when span b cuts span. so, in this case, we end the trade and selling the crypto because it is a downward trend. As soon as possible we leave the market other we face the losses.

What is the Ichimoku trend confirmation strategy with the cloud (Kumo)? And what are the signals that detect a trend reversal? (Screenshot required)
there are three types of trend confirmation strategy exist in the Kumo cloud. with the help of these three trends, we take a straight path to our trading.
first, is the direction of the Kumo cloud follows the same path of the price. so, the signal shows the confirmed strategy. because the signal shows the same path.
The second is when the span lines move sideways means it moves left or right direction. so, in their result, we couldn't determine the price action either downward or either upward.
The third is the Bullish trend. in this trend cloud continuously, move in an upward direction.
The fourth is the Bearish trend. in this trend cloud continuously moves in downward direction.
if anyone more signal crosses the SSA or the SSB line so, this signal is known as a trend reversal. in our trade this type of behavior comes so, we should change our trade because after that signal trade also be change. there is a one another indicator that finds the equilibrium known as the Ichimoku Kinko Hyo indicator. this indicator contains very high support or resistance.

Explain the trading strategy using the cloud and the chikou span together
As we all know that the cloud is made up of 5 lines in these five lines one line is called chikou span this is give very helpful support to Ichimoku Kinko Hyo indicator. this line represented the 26 periods behind closing our asset price.
let's consider which is using the span or the cloud for our desired signal. our work is to examine the relationship between this line and the what of price in this line.
As I early mention the lagging span or Chikou span line lies above the cloud. so, the price shows the uptrend. this is the sign that we have a valid or secure signal.
in such a case the lagging span or chikou span lies above the cloud and the price didn't have a resistance point. so, we book a buy order. and in such a case if the cloud lies below the price. so, we didn't make a good support. in this case we set a selling order. if both conditions didn't meet up so, then we should wait for a good signal.

Explain the use of the Ichimoku indicator for the scalping trading strategy
the Kumo cloud is eligible for both types of trade either it is higher or a lower framework. as you know the scalper using the lower time frame so, you must use 1-15 min time frame scalping trading. your buy and selling depend on what signal you choose or what type of time frame you choose. if you choose a good time frame you would start your buying or selling trade.
Conclusion:
The Kumo cloud or Ichimuko indicator is a very good tool to understand the technical analysis with the help of this indicator we find the uptrend or downtrend in a good manner. it provides a healthy support and resistance as compared to traditional support and resistance. but this indicator is quite difficult to understand but is easy to implement.

That's it!
Thank you!

Special mentions:
@kouba01




Hello @yarhassan,
Thank you for participating in the 5th Week Crypto Course in its third season and for your efforts to complete the suggested tasks, you deserve a 4/10 rating, according to the following scale:
My review :
An article with poor content due to the absence of analysis for several aspects of the topic, and here are the details.
You confused the Kumo cloud with the Ichimoku indicator. The cloud consists of only two lines SSA and SSB.
In the second question, you did not delve into analyzing the relationship between price action momentum and the Ichimoku cloud, especially using Kumo Thickening. As well as for determining levels of support and resistance that differ from the traditional method.
As for the relationship of this cloud to the price movement, it can be determined according to the thickness of the cloud, where the higher the density of the cloud, this indicates the high volatility of the market in that period. The increased price movement and its volatility will lead to the divergence of the two lines, which gives us the impression of stronger fluctuation in the price movement.
As for determining the levels of support and resistance based on the Ichimoku cloud, it differs from the traditional method, and this is what you are asked to interpret.
Your interpretation of the twist and how to use it when trading is missing also some depth in the analysis.
Thanks again for your effort, and we look forward to reading your next work.
Sincerely,@kouba01
Downvoting a post can decrease pending rewards and make it less visible. Common reasons:
Submit