Hello All....
Today I will try to join the class of professor @imagen, about Introduction to Technical Analysis of Price Patterns. This is a very interesting class. well, I will do the homework by answering some of the questions given.
.jpg) Background from canva
Background from canvaStaking on JustSwap
So I will try to do staking, as for the platforms and wallets that I use are:
- Platform : JustSwap
- Wallet : TronLink
JustSwap
As for the reason I chose JustSwap because this platform offers high and safe profits, and I have also installed an extension on my PC screen, so I can more easily use it to Staking.
How to Link TronLink to JustSwap Platform
Well the first thing to do is to link the JustSwap platform with the Tronlink wallet. here are the steps I did.
- First Open the JustSwap platform then click Conncect to Wallet

- Then I choose TronLink Wallet

- Then I open the tronlink wallet on the extension and fill in the password

- Then I have successfully opened my TronLink
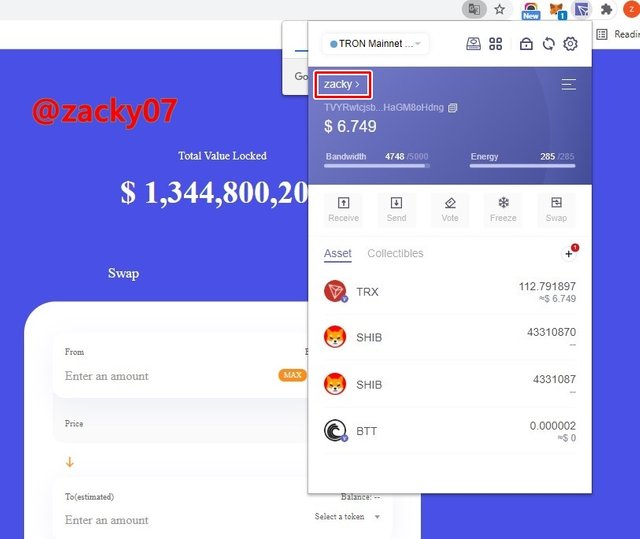
- And I have successfully linked the JustSwap platform with my TronLink wallet

Staking NFT-TRX
So I chose to do staking by choosing NFT and TRX because the percentage of APY given was very large, namely 102.33%

The stages of staking that I do are:
- The first thing I did was swap to get NFT coins, I did swap 10 TRX.
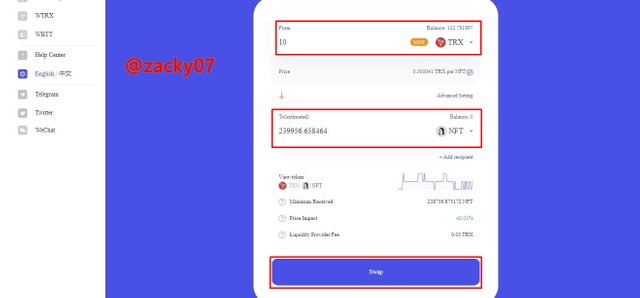
- From 10 TRX I will get 239956.65 NFT coins, then I click confirm swap

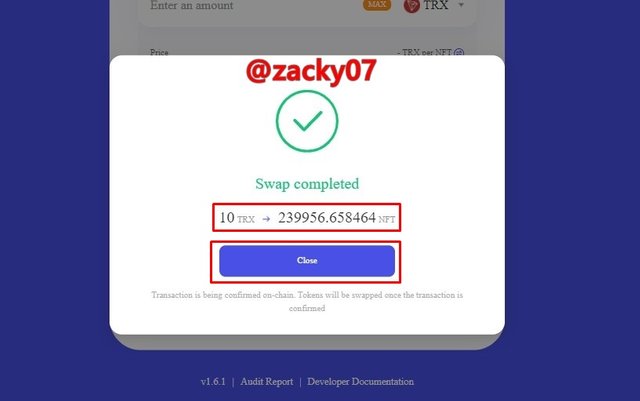
- Swap transaction has been successful
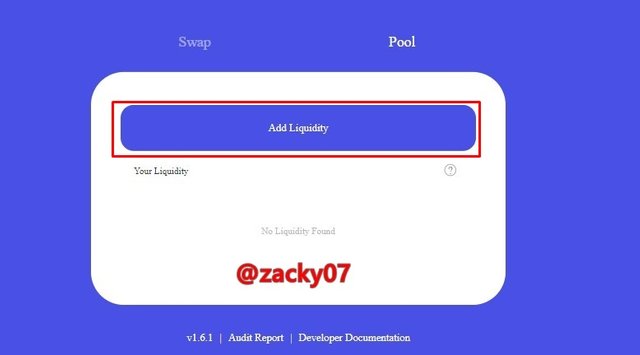
- After that we add liquidity to get LP tokens
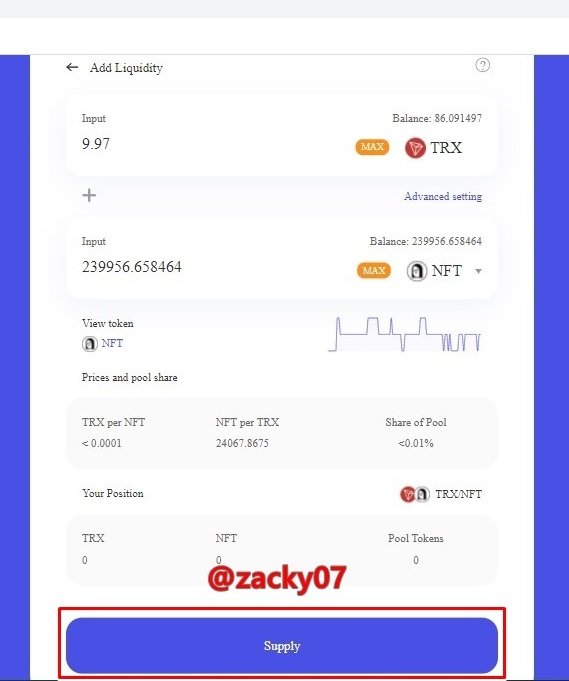
- After that click supply
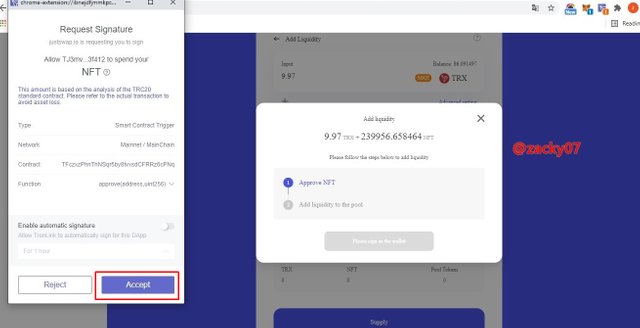
- After that a notification appears and click Accept
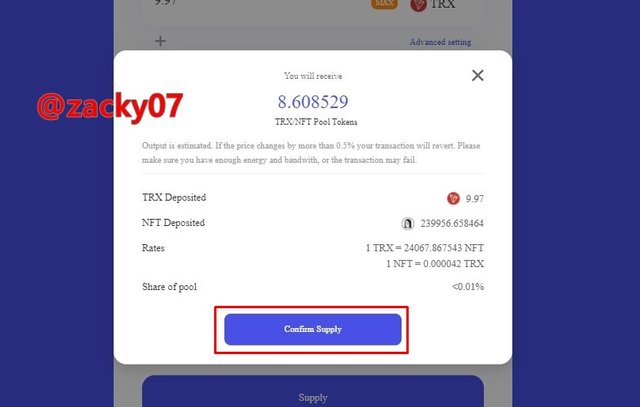
- After that Click Confirm Supply
- After that a notification appears again and click accept
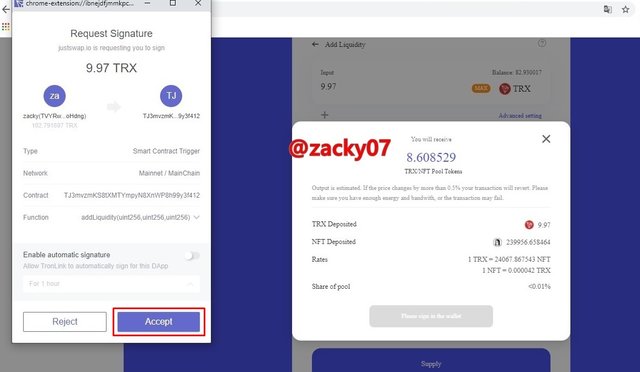
- And liquidity has been successfully carried out
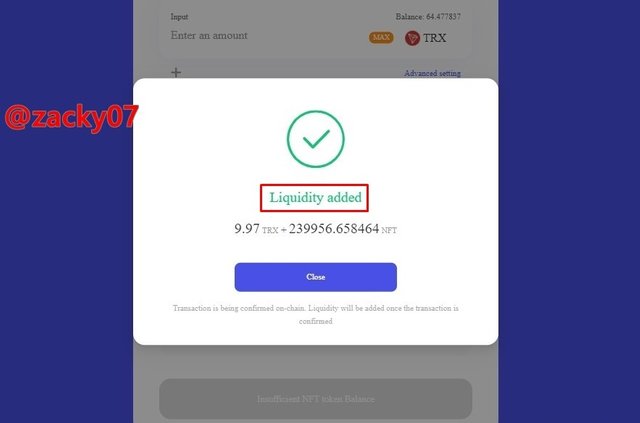
- The LP tokens obtained are 8,065 Pool Tokens
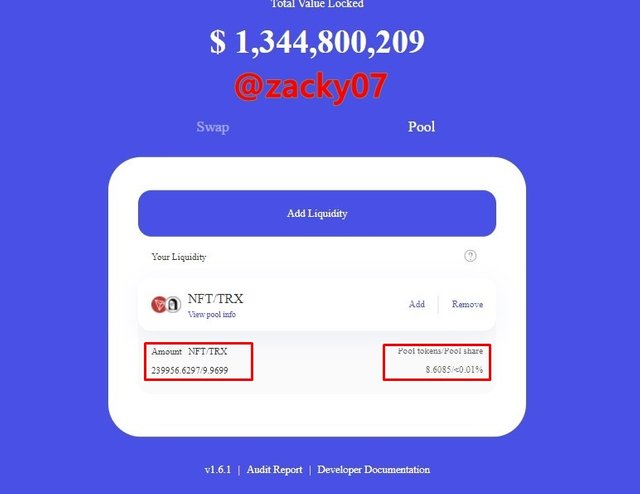
- After that we will do staking
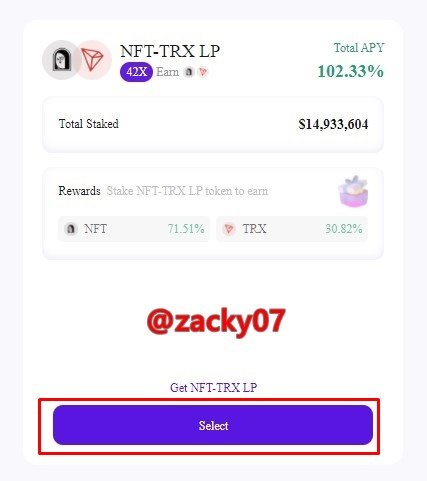
- Then click approve NFT-TRX LP
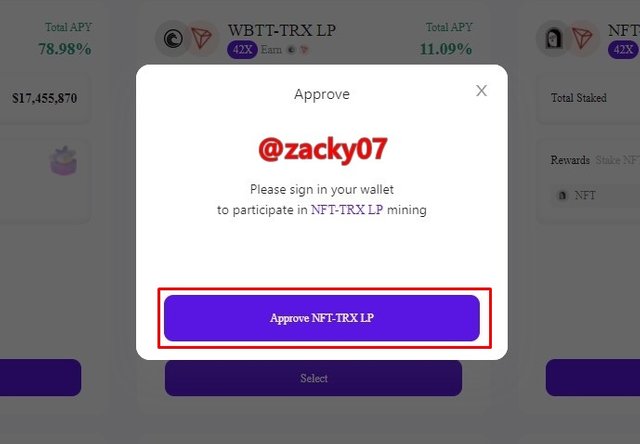
- We can see the number of LP tokens as in the picture, then click stake
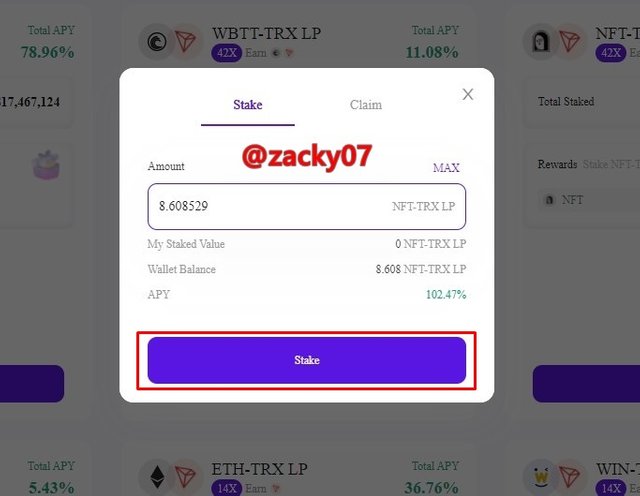
- After that a notification appears click accept
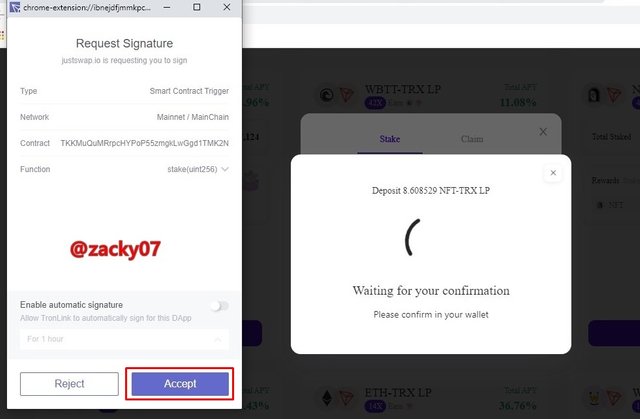
- And staking has been successful
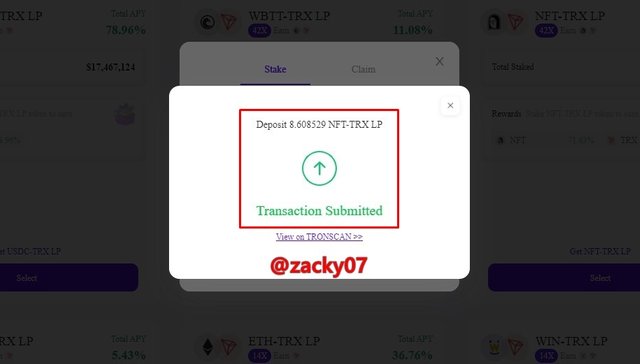
- As for we can see some information from the percentage of APY given which is 102.44%, which is distributed to two coins, namely NFT 71.62% and TRX 30.82%.
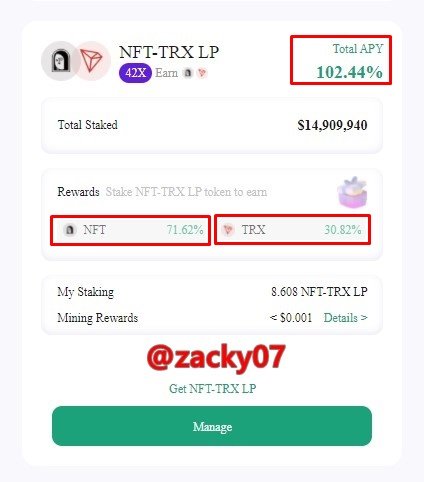
Amount of coins generated as a percentage of APY (In USD)
Basic information of staking I have done
- Total APY : 102.44%
- APY NFT : 71.62%
- APY TRX : 30.82%
- Total TRX staked: 9.97 TRX
- Total NFT staked: 239956.65 NFT
- TRX price in USD : $0.059

screenshoot from coinmarketcap
- NFT price in USD : $0.0000024

screenshoot from coinmarketcap
So let's see how much TRX and NFT you get as a percentage of APR, and how much USD you get
The number of 1 year NFT obtained is: 71.62% x 239956.65 = 171856.95 NFT
Total TRX 1 year obtained is: 30.82% x 9.97 = 3.07 TRX
Amount of NFT to USD conversion = 0.0000024 x 171856.95 = $0.41
TRX to USD conversion amount = 0.059 x 3.07 = $0.18
Total USD earned 1 year = $0.41 + $0.18 = $0.59
So from staking that I do with 9.97 TRX and 239956.65 NFT I will earn $ 0.059 every 1 year.
Technical Analysis ( 3 Cryptocurrencies )
7-day Technical Analysis (Litecoin)
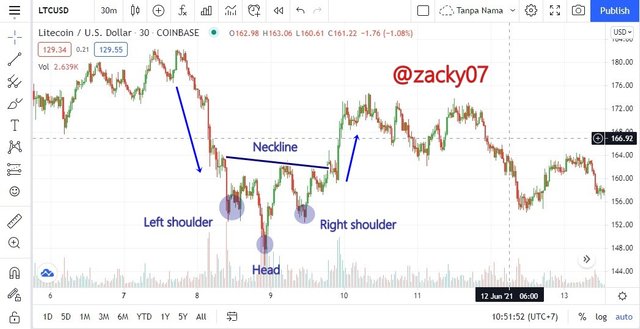
screenshoot from tradingview
LTC (Inverse Head and Shoulders Chart Pattern)
As shown in the chart data above, I did a technical analysis of the Litecoin chart for 7 days, i.e. I took it on the 6th to the 13th, the interesting thing we can see is that on the 8th the graph is experiencing a downtrend and then forms a inverse head and shoulders pattern . then after the pattern is formed the graph experiences a trend reversal to become an uptrend. so on the LTC chart that I am analyzing the chart is experiencing a reversal pattern.
30-day Technical Analysis (Litecoin)
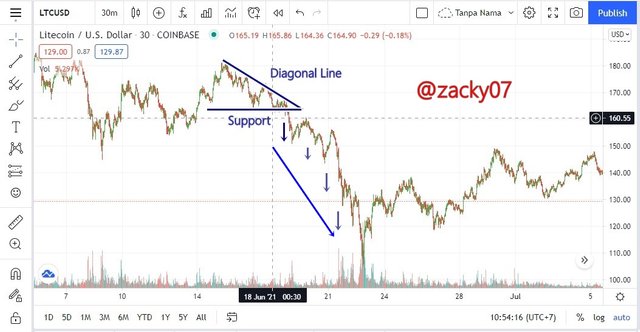.jpg) screenshoot from tradingview
screenshoot from tradingviewLTC (Triangle Chart Pattern)
As shown in the chart data above, I did a technical analysis of the Litecoin chart with a 30-day timeframe, in this pattern we can see that on the 15th the chart experienced a repeated downtrend phase to form a triangle pattern. We can draw the pattern by connecting the resistance points and forming a diagonal line, then when we find the corner of the previous support zone we can draw a horizontal line. after the pattern occurs the chart continues to experience a downtrend. so on the 30-day LTC chart above the chart is experiencing a continuation pattern.
7-day Technical Analysis (Cardano)
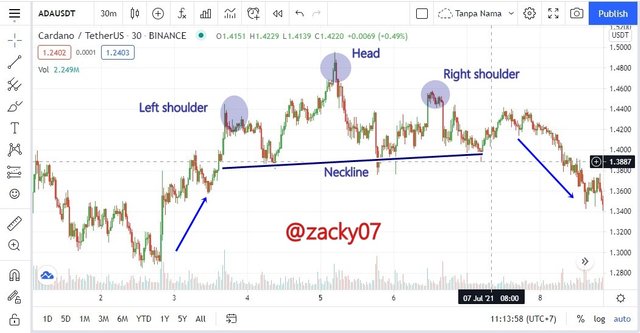.jpg) screenshoot from tradingview
screenshoot from tradingviewADA (Head and Shoulders Chart Pattern)
As shown in the chart data above, I did a technical analysis of the Cardano chart for a period of 7 days. The interesting thing is that on the 3rd the chart experienced an uptrend and then formed a head and shoulders pattern. then after the pattern is formed the chart experiences a trend reversal to a downtrend. so on the cardano chart that I analyzed the chart experienced a reversal pattern.
30-day Technical Analysis (Cardano)
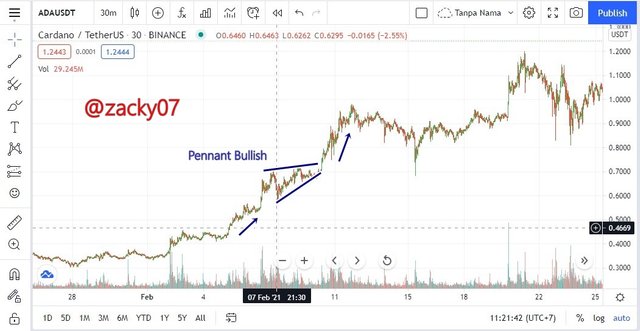.jpg) screenshoot from tradingview
screenshoot from tradingviewADA (Pennant Chart Pattern)
As shown in the chart data above, I did a technical analysis of the Cardano chart for a period of 30 days. we can see that on the 1st the chart experienced an uptrend then formed a Pennant pattern in a bullish phase, then after the pattern was formed the graph continued the bullish phase. so on the cardano chart that I analyzed, the chart experienced a continuation pattern.
7-day Technical Analysis (Polkadot)
.jpg) screenshoot from tradingview
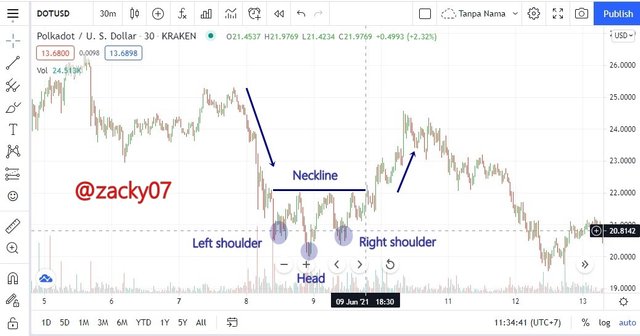
screenshoot from tradingviewDOT (Inverse Head and Shoulders Chart Pattern)
As shown in the chart data above, I did a technical analysis of the Polkadot chart for a period of 7 days. The interesting thing is that on the 7th the chart experienced a downtrend and then formed the Inverse head and shoulders pattern. then after the pattern is formed the chart experiences a trend reversal to become an uptrend. so on the Polkadot chart that I analyzed the chart experienced a reversal pattern.
30-day Technical Analysis (Polkadot)
.jpg) screenshoot from tradingview
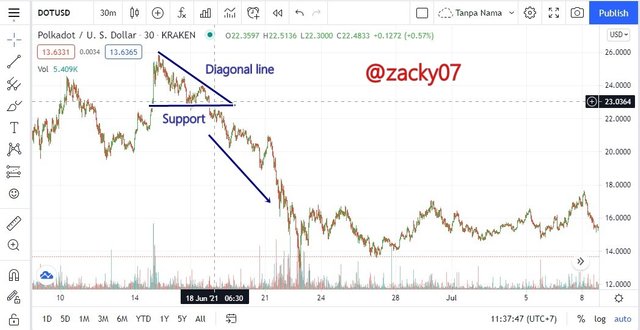
screenshoot from tradingviewDOT (Triangle Chart Pattern)
As shown in the chart data above, I did a technical analysis of the Polka-dot chart with a timeframe of 30 days, in this pattern we can see that on the 15th the chart experienced a repeated downtrend phase so that it formed a triangle pattern. We can draw the pattern by connecting the resistance points and forming a diagonal line, then when we find the corner of the previous support zone we can draw a horizontal line that is connected to the support point. after the pattern occurs the chart continues to experience a downtrend. so on the 30-day Polka-dot chart above, the chart is experiencing a continuation pattern.
Bullish Season and Bearish Season
The bullish season and the bearish season are the seasons that occur in a cryptocurrency caused by the activity of buyers and sellers trading at a time, to be able to tell the difference, let's try to summarize.
Bullish Season
Bullish season is a season that occurs in cryptocurrency assets caused by the activity of buyers who are more dominant than sellers. so that the value of an asset continues to increase over time. so in this period the uptrend chart pattern occurs repeatedly. this can be caused by several factors such as news stories that can influence someone to invest in these assets. Therefore, every trader who wants to make a profit in his trade must be able to master technical, fundamental, and sentimental analysis. so that traders can know when is the right time to buy and sell their assets.

screenshoot from tradingview
(Bullish Season)
Bearish Season
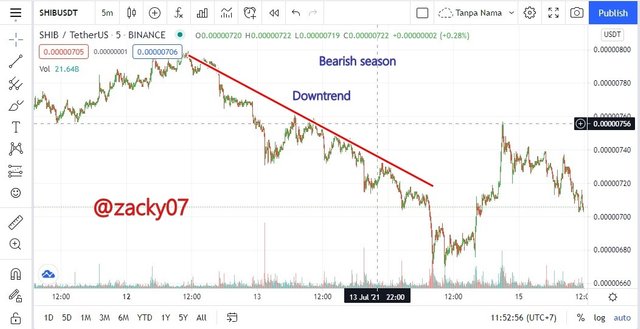
Bearish season is a season that occurs in cryptocurrency assets caused by the activity of sellers who are more dominant than buyers. This can cause the value of an asset to decrease for some time. so in this period the downtrend chart pattern occurs repeatedly. during the bearish season because asset holders want to sell their assets to take profits.
screenshoot from tradingview
(Bearish Season)
Conclusion
Staking is one way to earn from APY or APR returns offered on a platform, we can choose which platform is suitable and which coin matches the percentage rate of return offered. this can be said indirectly we will earn passively.
In performing technical analysis the pattern of a chart is the most basic thing that traders must know before trading, by knowing the pattern from the graph traders can predict the pattern of the next chart movement, traders can also know the current bearish and bullish season, so that with careful preparation before trading, the opportunity to get a profit is even greater.
Thank you for reading my homework
CC: @imagen
Thank you for participating in Season 3 of the Steemit Crypto Academy.
Congratulations, you did a great job.
I look forward to continuing to correct your next assignments.
Downvoting a post can decrease pending rewards and make it less visible. Common reasons:
Submit
Thank you very much professor @imagen 🤝😁.
Downvoting a post can decrease pending rewards and make it less visible. Common reasons:
Submit