Hello Steemians how are you i hope you will be fine. Alhamdulilah I am also good with the grace of Allah Almighty. I am very thankful to Professor: @lenonmc21 for this wonderful lecture. So lets discuss.
Question:
Define in your own words what is a "Trend" and trend lines and what is their role in charts?
Ans:
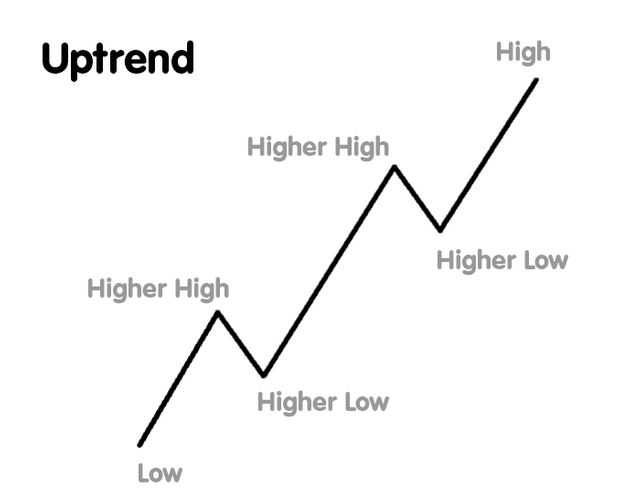
Generally, this term is called change. In the world of cryptography, trends mean market orientation. We can say that trend as a general line or a general flow direction. In other words, this is the predominant or more accepted direction of motion. The goal is to determine what the next market trend will be. It helps us make decisions in the market. In addition, coin charts and trading theory also allow the user to guess what is currently on the market. So the kind "trend" is very important in a crypto world, and we use it often. This trend is actually an understandable trend of prices moving in a certain direction. This trend can be up and down . Typically in a market structure, we have 3 price movements that are up, down or around it. The implication here is that the trend takes care of two people, which is an uptrend.
Trend lines are used to indicate the direction of value levels . A trend line is the sing of direction and movement of the price. If it continues for a long time without deviation, in case of deviation, the trend line should be updated. Trend lines are often drawn to see specific market trends. As it develops, it provides a clear picture of the structure of markets. The line is drawn from the top of an axis or from the bottom of the axis of the graph.
There are five types of trend lines Now here i want to describes these types of trend lines for furtehr detail:
- Linear
- Polynomial
- Exponential
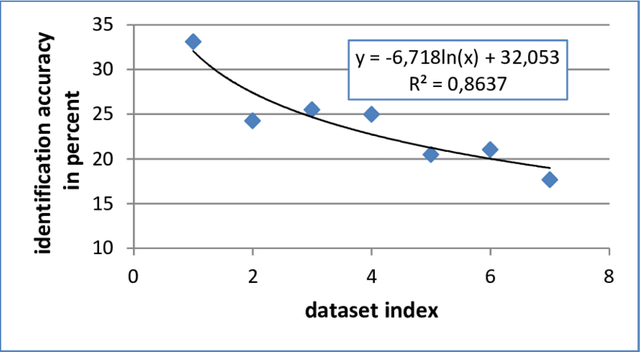
- Logarithmic
- Power
1. Linear:
A linear trend line is a perfectly straight line. If the pattern of your data points matches a line, your data is linear. A linear train usually indicates that something is rising or falling at a constant speed.
2. Polynomial:
If the value of data decreases from time to time, then the Polynomial line can be seen.
3. Exponential:
If the value of data up or down rapidly, Exponential trend line can be seen.
4. Logarithmic:
If there is a sharp up and in the value and then level out. In this situation we can see logarithmic trend lines.
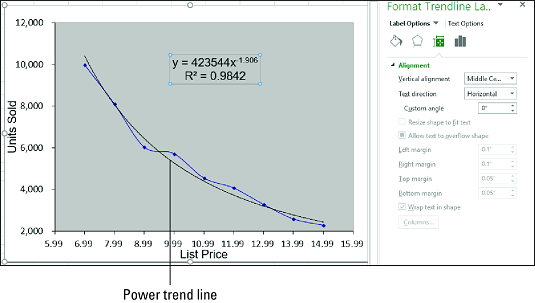
5. Power:
Power lines are used when the value up or down in curve shape at a specific rate.
source
Here i want to describe types of trends according to movement in chart:
Types of Trends:
There are two types of trends:
- Bullish Trend
- Bearish Trend
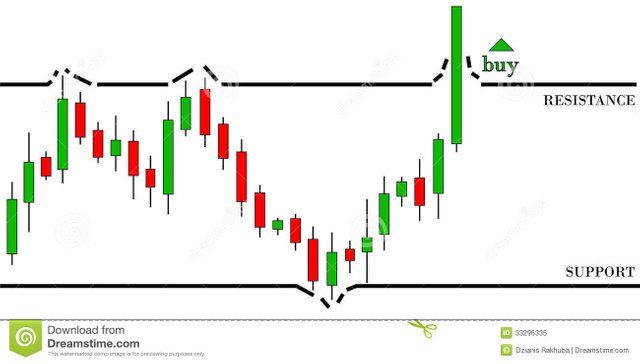
1. Bullish Trend:
This shows that prices in the market are rising.
source
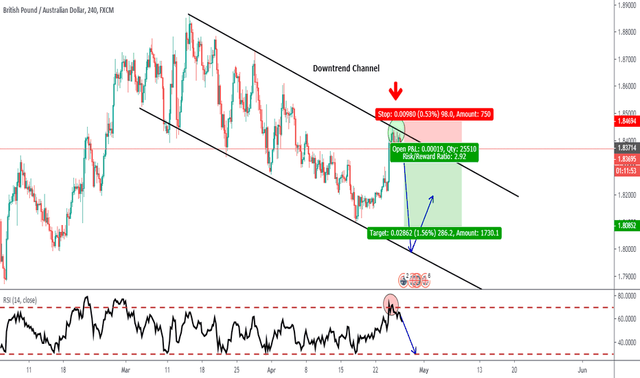
2. Bearish Trend:
This shows that prices in the market are going down.
source
Question:
Explain how to draw an uptrend line and a downtrend line (Show a screenshot of each)?
Ans:
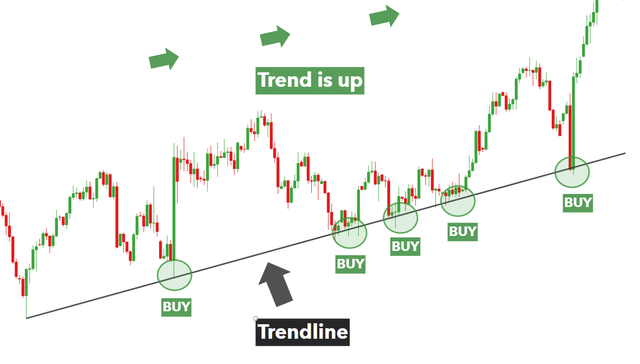
Uptrend line:
By connecting rotating lines or increasing the minimum points, an uptrend trend line is created.
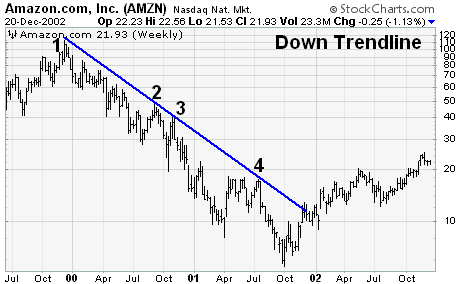
Downtrend line:
The downtrend line is formed by joining the oscillation lines or decreasing the maximum points.
source
The uptrend lines are below the price and the downtrend lines are above the price.
Question:
Define in your own words what "Supports and Resistances are and how we can identify both zones (Show a screenshot of each one).
Ans:
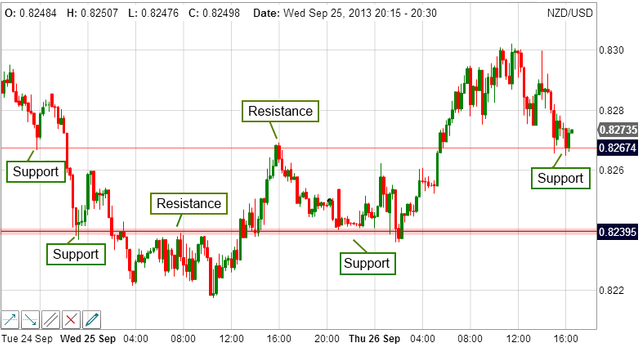
Supports and Resistance Level:
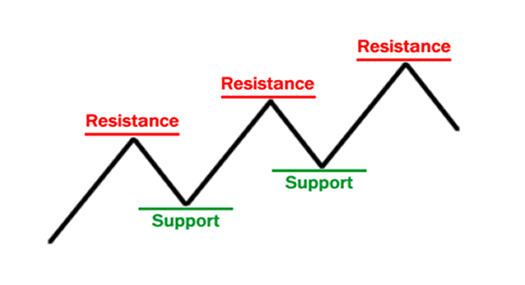
source
Supports:
When the price starts to fall, then downtrend starts. When the price stops, or decrease. This is the support level. When the price goes down, people start investment. This is where people are not expected to sell coins. Because the price of coins and selling coins in this place is deprived of money. There are two types of supports:
- Horizontal support
- Diagonal support
Resistance:
On the other hand, true resistance is the opposite of support. This is a range or point range where prices are likely to rise and begin to fall as prices rise. The price will skyrocket instead of breaking. Resistance indicates a high level of stock price. The resistance forces the merchants to sell. The price continues to rise until it reaches another resistance level. There are two types of Resistance:
- Horizontal Resistance
- Diagonal Resistance
Question :
Explain in your own words at least 2 simple chart patterns with screenshots?
Ans:
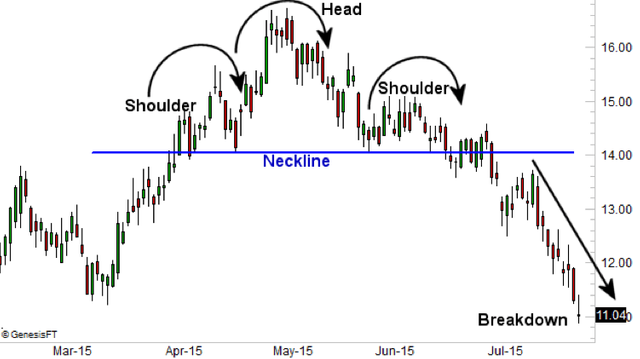
Head and Shoulder:
This type of chart is used to indicate that the market is trending downwards. This is a called a chart pattern in which the uptrend only fails, in other words it happens that the uptrend occurs but after a second short downward movement the next height is lower than the previous highest level.
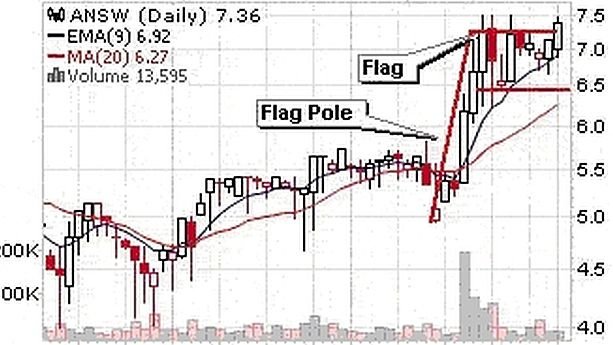
Flag:
According to the In technical analysis, the flag chart is aso called a price chart. That has a fast counter-trend to overcome the short-term trend. Flag patterns show a failure trend after a period of stability.
Conclusion:
This lesson taught me about the different trends in charts. Studying trend charts and lines allows consumers to analyze and understand market trends and engage in trading. The trendlines are discussed in detail in this lecture. The uptrend and downtrend are explained very well in this lecture. In this lecture i have learned about Resistance and support are also important tools for technical analysis in trade and help in decision making, monitoring and predicting price movements. Again I am very thankful to Professor @lenonmc21 for this informative lecture.

I hope you will get the success and get 10 marks from this homework. You had done the homework nicely and clearly .
Downvoting a post can decrease pending rewards and make it less visible. Common reasons:
Submit
thanks
Downvoting a post can decrease pending rewards and make it less visible. Common reasons:
Submit
Hello Professor @lenonmc21 I have submitted my homework 3 days ago but yet not checked by you. Please check my homework kindly. Thanks
https://steemit.com/hive-108451/@zeeshanakram/crypto-academy-season-3-week-3-homework-post-for-professor-lenonmc21-trends-trend-lines-and-chart-patterns-by-zeeshanakram
Downvoting a post can decrease pending rewards and make it less visible. Common reasons:
Submit