
In your own words explain the vortex indicator and how it is calculated
This is a technical indicator used to analyse the market moves. As any other indicator, it also uses the market history to analyse the next trend. This is very helpful in predicting trend reversals. It is a combination of two indicators ADX(Average directional index) & ATR(Average true range)It is composed of two lines, one is +VI & another is -VI. When +VI crosses above -VI. It shows the uptrend. When -VI crosses +VI. It shows a downtrend. This indicator first appeared in 2010 in a magazine. This indicator is created by Douglas Shipman & Etienne Botes. If the +VI line crosses the -VI line from the bottom up, it indicates a bullish trend start. Therefore, it signals to buy.
If the -VI line crosses the +VI line from the bottom up, it indicates a bearish trend start. Therefore, I signals sell.
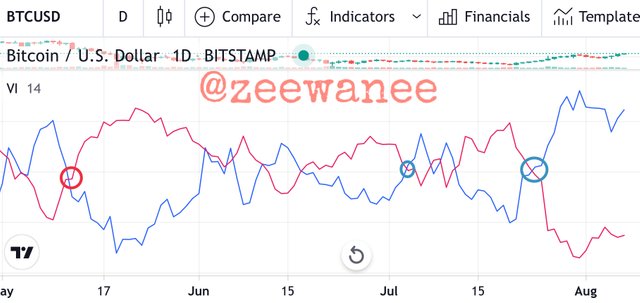
Vortex indicator
This is a small illustration of the vortex indicator. This is an illustration of the BTC/USDT chart. Now let's see how to calculate the vortex indicator
Determining the trend
As we know that a distance between the current high and the previous low represents the upward trend & the distance between the current low and the previous high shows the downward trend. But the distance between the lines indicates how strong/weak the trend is. More distance means a stronger trend & less distance means a weak trend.Trend
Here, upward and downward movements are calculated. The downward movement is calculated by subtracting the previous high from the current low. While the uptrend movement is calculated by subtracting the previous low from the current high.This will be simply understood as
Upward movement=Current high-Previous low.
Downward movement=Current low-Previous high..Period
Generally the 14 periods are selected.It is selected by default. One can easily edit this, but it is considered to give the best results possible. Some of the traders also use 25,28,26 periods. Remember it can be edited as per the need.
Is the vortex indicator reliable? Explain
I will never say an indicator alone is reliable. Be it vortex or any other indicator.No indicator alone is completely reliable. We can say an indicator is reliable when it gives us the correct trend information. I will say the vortex indicator is reliable when the signal from this indicator is also supported by other indicators. Indicators can only predict the trend. I made a comparison between MACD indicator & vortex indicator in which I found that vortex gives the signal but it lags behind.The MACD gave a buy signal on 12-JAN while the vortex gave a buy signal on 20-JAN.That's a lot of time, this time is more then enough for the trend to reverse.
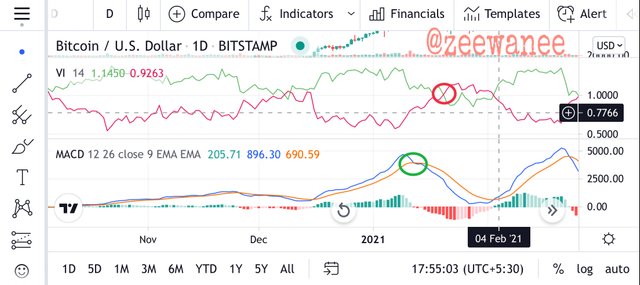
Vortex & MACD comparison
The indicators are used to identify trend reversal. The vortex indicator gives correct information but various indicators indicate the trend before the vortex does, I won't say it is useless, but with the help of other indicators this is a good indicator but not so much reliable.
How is the vortex indicator added to a chart and what are the recommended parameters? (Screenshot required)-
We will visit tradingview
Open any chart of your choice & click the option fx indicators.
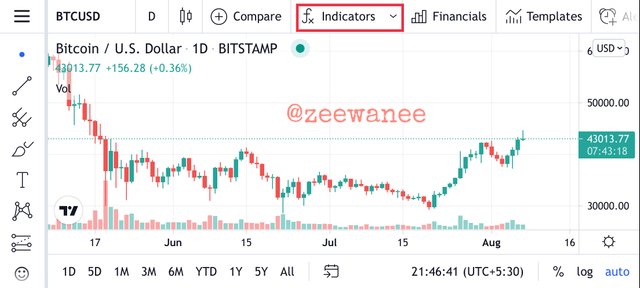
Trading view chartAfter clicking on fx menu search VI or vortex indicator.
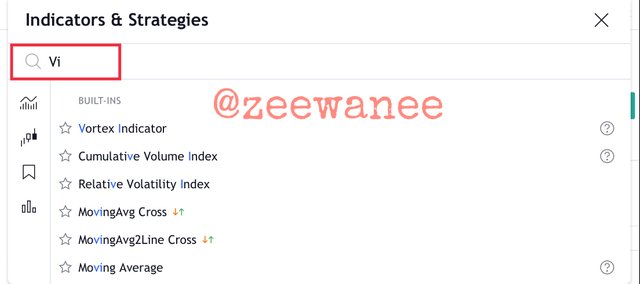
Tradingview searchAfter clicking on the vortex indicator, the vertex inspector is successfully applied to the graph.
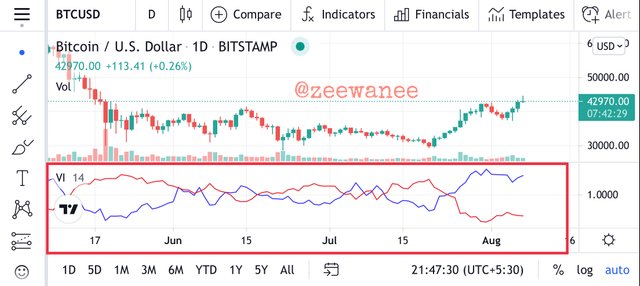
Vortex indicator appliedClick anywhere on the vortex indicator & a menu will pop up on the left side of the screen.Click the settings icon to change few things.
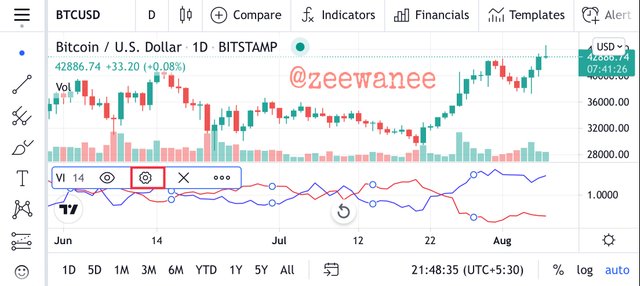
Vortex indicator settingAfter the settings open you can find three options Input, Style, Visibility. Click Style & a colour menu will pop I will be choosing green in place of blue colour.
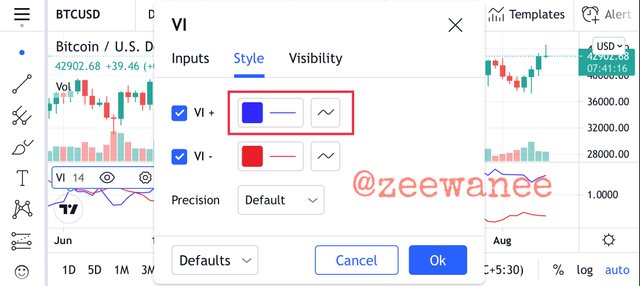
Vortex index stylesAfter changing the colour of the indicator.the vortex indicator looks like this
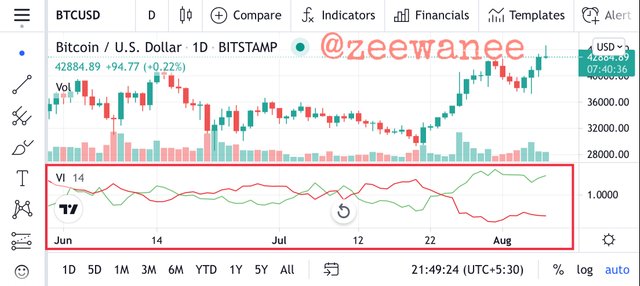
Vortex indicator with green & red colour
What are the required parameters?
The default length of a period is 14. This is set by default & it is tried & proved method to get the best result possible. One can always change the period length. A wider market is good to be studied with vortex indicators.
Time frame, I would recommend a larger time frame because the larger the time frame the more accurate the result is. Smaller time frames can lead to wrong indicators which will lead to wrong buys & sells. Which will eventually make you lose money. So I will recommend using larger fine frames.
The default colour is selected as red & blue. The colour is also not limited. One can change the colour whenever he wants & whatever colour he wants. I choose green & red because it is easy to differentiate because now I have generated a habit of looking at candlesticks with red & green sticks. One can use any colour he/she is comfortable with.
Explain in your own words the concept of vortex indicator divergence with examples. (Screenshot required)
There are two types of divergences in vortex indicator. One is bearish divergence & the other is a bullish divergence.Lets take an example of each
Bearish divergence
When you carefully examine the graphs you can easily see that the trend is upwards but the VI shows a downtrend. So here is the divergence in the case of a bearish trend, which signals sell as per the vortex indicator.
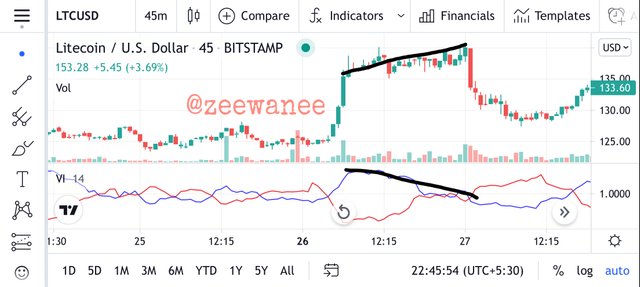
VI divergence in case of bearish trend
Bullish divergence
While in this case, the price decreases the -VI should move up but instead it is moving downwards. It is a behaviour against the trend. So this is a case of bullish diversion.
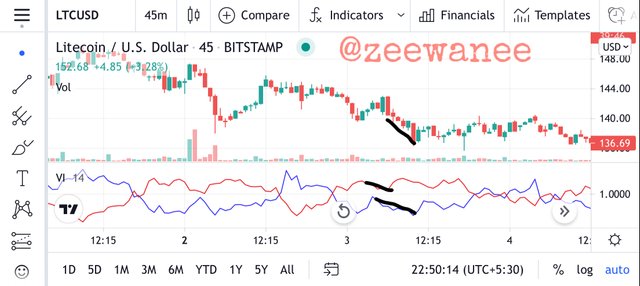
VI divergence in case of bullish trend
Use the signals of VI to buy and sell any two cryptocurrencies. (Screenshot required)
- Let's take BTC/USDT.
- Now we will apply VI to this graph & the candlestick is set to 45m.
- Once the VI is applied one can clearly see that bitcoin produces buy signal.Wo I will buy at this particular point.
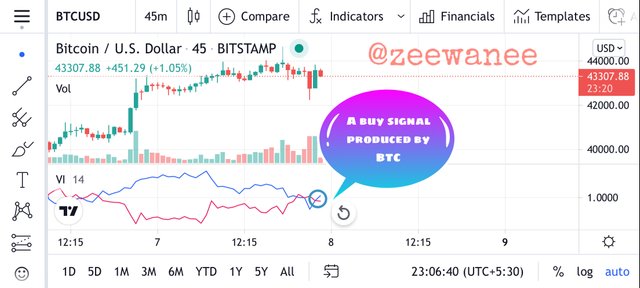
Bitcoin buy signal
Let's take a look at the chart where we will sell a crypto after looking at the VI.
- Let's take ETH/USD
- Add VI to the chart
- Set any time frame I choose a 30-min time frame & it shows a sell signal.
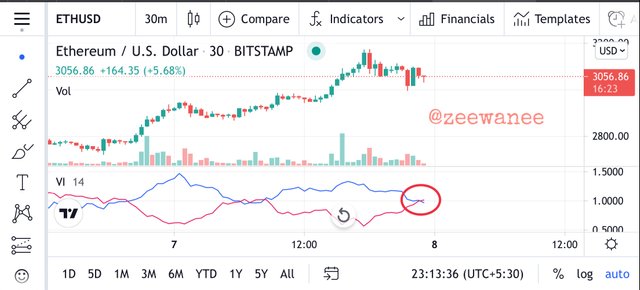
ETH sell signal
Note: Sir I will not be able to make a real transaction because I recently changed password of my exchange account. Now it's locked for 48 hours. That's the reason I am unable to perform a real transaction.Hope that does not affect the grades.
CONCLUSION
I would like to thank @asaj for this awesome lecture. After understanding the lecture I know how to apply VI. I know how to change the periods & the colour of VI. After doing some research I came to know that VI is a combination of two different indicators. After. The lecture I came to know that the indicator is pretty good but late as compared to MACD.
Good job @zeewanee!
Thanks for performing the above task in the sixth week of Steemit Crypto Academy Season 3. The time and effort put into this work is appreciated. Hence, you have scored 7 out of 10. Here are the details:
Remarks
You displayed a good understanding of the topic.
Downvoting a post can decrease pending rewards and make it less visible. Common reasons:
Submit