
Hello to everyone out there, I would love to join Prof. @pelon53 to welcome each and everyone to the first week of this season. The topic for this week is Metric Indicators and I'll try my best to give detailed answers to the test questions listed. If you reach the requirements, you could join me to do same my reading up the lesson on this link.

1.)
The Puell Multiple indicator is an indicator created by David Puell in 2019. Now we see were the name Puell came from. It is an indicator which uses data of the current amount of income received by miners to their yearly average income to help long term traders analyse on when to make a buy order or sell order on coins.
It doesn't have time frames for minutes or hours and this makes it good to be accompanied with indicators like the Stochastic or EMA for daily trades.
.png)
From the image above we can see the mathematical equation which gives us values displayed on the Puell multiple indicator. Now let's take a look at the current graph for bitcoin from lookintobitcoin.com
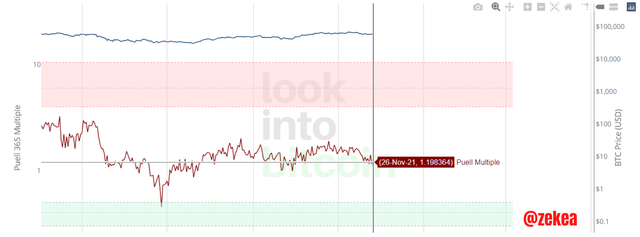
Answer for (a) From the indicator above we can see that current value for bitcoin is 1.198364
b.)
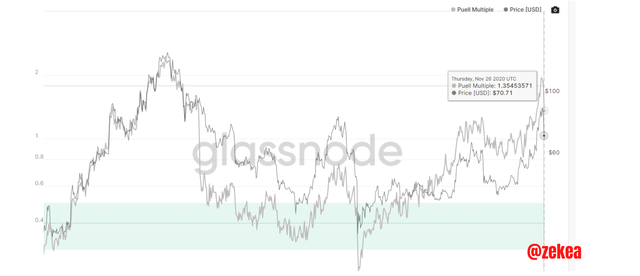
With the current Puell Multiple indicator on glassnode for LTC, the value for the Puell Multiple is 1.35453571.
Like I said the Puell Multiple indicator is a long investment tool and isn't really good for making daily trade to acquire some profit. Let's use an illustration of an investor to do some analysis of how the income spread of LTC miner's affect of the coins price.
All screenshots for this part taken from glassnode
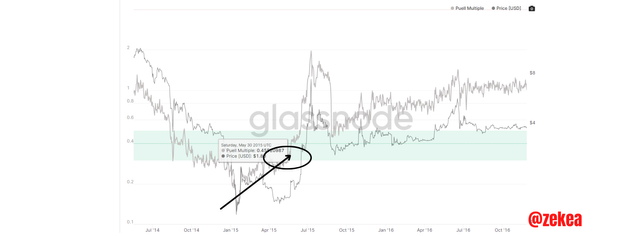
From the chart above we can see that on May 30, 2015, the PMI (Puell Multiple Indicator) is at the green area. Its value is still at 0.45 and this calls a good time for investors to buy the coin. The price of the LTC token was at a low of $1.8.
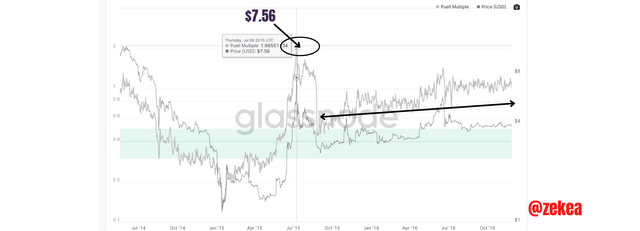
From what we can see after making the buy trade on May 30, 2015, the price went up to as high as $7.56, meaning the investor had x4 of his initial investment amount but since the indicator was not at the red side. It was still at a low value of 1.9 which means the price still has potential to get higher in some months. A good investor would wait because the price hasn't hit its maximum value. After then, unfortunately, the price came down and was ranging for some months. The investor isn't still in a loss.
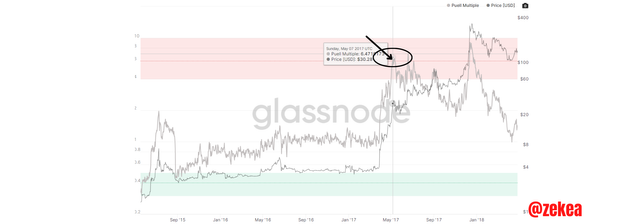
On May 7th 2017, when the PMI oscillator approaches the red side which is the sell area, the investor can decide to sell his assets at a price of $30 which means the value of those assets increased by 1,657% and he makes a lot of profit off the trade.
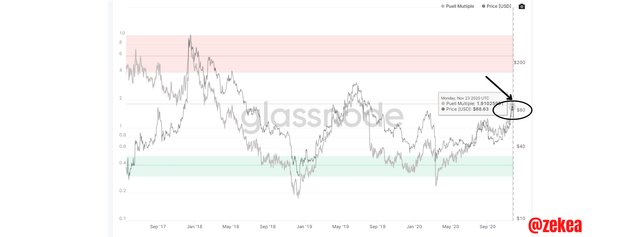
As at Nov 23, 2020, the price of the LTC coin was at $88 with a low PMI value of 1.9 which means the coin still has a high potential to increase to a higher price.
.png)
Since there isn't a current Puell Multiple Indicator chart in the past year for the LTC, lets use coinmarketcap to evaluate more on the coin. It has a current price of $197.38 with a market cap of $13,631,879,478 for a circulating supply of just 69,064,119.82 LTC coins. In the past 1 year, it has an all time low of $68.55 and an all time high of $412. It currently ranks 16th in the world.

2.)
When Satoshi Nakamoto invented Bitcoin in 2009, he found out a method of distributing the currency without a central authority deciding who will get it. He invented a process making nodes on the network to mine or validate transactions and get rewards for it. In order to control inflation of the currency, halving was introduced.
Halving is a mechanism where the total amount of rewards given to miners in a blockchain are reduced by half. This mechanism automatically occurs at a particular period. This means that if 100 bitcoins were rewarded to the miners, at a certain period, the rewards would be reduced to 50 bitcoins.
Halving takes place affect the mining of every 210,000 blocks in the bitcoin blockchain.
Importance of Halving
Some people may say the halving process is unfair to cryptocurrency miners but it isn't. This is because of the law of demand and supply, if there is high distribution or production of a coin into the economy, there will be a lot of bitcoins in circulation and this makes the coin so easy to get. Because of this, there will be low demand for the coin and high supply and this will drastically affect price of the asset.
So, from the above we have noted that halving is a means of controlling inflation in the economy of cryptocurrencies.
What are the next Reward values for Bitcoin Miners and When will it take Place
Bitcoin was invented in 2009 and back then the reward value was 50 BTC per block, currently, the reward value is at 6.25 BTC which means that it has been halved for up to 3 times. The total supply for bitcoin is 21,000,000 and I will try to show a spread for series of rewards miners will attain for a block before it gets to zero
| Year | Halving Position | Reward |
|---|---|---|
| 2012 | 1st | 25 BTC |
| 2016 | 2nd | 12.5 BTC |
| 2020 | 3rd | 6.25 BTC |
| 2024 | 4th | 3.125 BTC |
| 2028 | 5th | 1.5625 BTC |
| 2032 | 6th | 0.7812 BTC |
| 2036 | 7th | 0.3906 BTC |
| ...2140 | 33rd | 0 BTC |
From the table above we can see the different rewards that would be given to the miners. From my analysis, the bitcoin mining will end in 2140 as the 33rd halving.

3.)
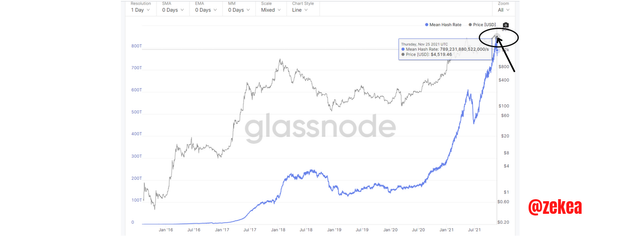
The Hash rate of a cryptocurrency network is the capacity of a network to compute as many operations. This is determined by the total number of miners in the network, meaning an increasing amount of miners also increases the hash rate. The hash rate indicator displays how the prices are affected by the hash functions of a network.
From the chart above, we can see that the current hash rate of the Ethereum network is 789,231,880,522,000/s. If we look closely we would see the development in the increase of computer operations performed in the network.

On July 10, 2016, we would see the hash rate at a low of 4,088,868,335,512.52/s with a price of $11.13 but over the years it has increased due to the increasing amount of miners. There was only a slight deep on the chart towards the ending of June 2021 when China banned mining due to high energy consumption.
If you look at the first chart above, you would see the hash rate oscillator and the price graph above it, this helps display that as people began to gain interest in Ethereum projects, the hash rate and the price increased together.

4.)
The Stock to flow model is an indicator produced by a Dutch man, known as Plan B. This indicator tries to determine the price of bitcoin using the law of demand and supply. This indicator uses the interrelationship between the level of scarcity of bitcoin to its price.
It is depicted by the formula,
SF= stock/flow
To calculate the stock to flow we need to collect all values

From coinmarketcap, we can see that the current stock is 18,884,831.00 BTC
Now all we need to do is to find flow, flow= the current amount of bitcoins mined/block x the number of blocks mined in a year
where,
the current amount of bitcoins mined/block= 6.25BTC
and he number of blocks mined in a year= 52,560 Blocks
Therefore, SF= 18,884,831.00/(6.25 x 52,560)
=18,884,831.00/328,500
=57.4221
Stock to flow Model= 0.4 x SF^3
= 0.4 x 57.4221^3
= 0.4 x 189,337.751
= 75,735.1003 BTC
What would Happen in the Next Halving
Bitcoin halves every four years and since the last halving was in 2020, the next one will be in 2024. On that day, the rewards given to miners will be reduced to 3.125 BTC per block. This automatic halving mechanism gives bitcoin a controlled distribution rate. Scarcity of the assets will be increased and will also result in a reduced rate of inflation.
From my analysis, since a total of 210,000 blocks have to be mined before halving starts, by 2024, the amount of bitcoin in circulation will be 19,687,500 BTC.
Therefore Stock= 19,687,500 BTC.
To Calculate the Stock to Flow model
Where,
Flow= 3.125 x 52,560
=164,250
And SF= 19,687,500/164,250
= 119.863
This shows that after every halving, the SF increases in multiples of 2.
Stock to Flow model= 0.4 x 119.863^3
=0.4 x 1,722,088.354
= 688,835.342
The value of the Stock to flow model also doubles every halving.
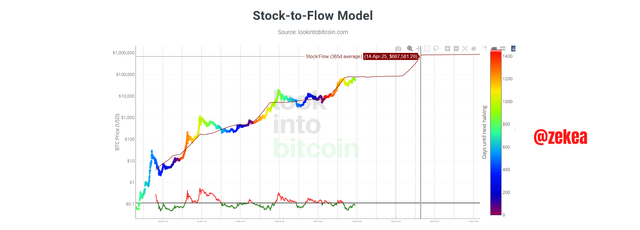
We can see that as at the values tally.

The Stock to Flow model is a very good indicator which tries to forecast the price the bitcoin tends to attain in some years to come. It seems so accurate, all the indicator taught in this lessons are long term indicators and are perfect for investors who plan to hodl coins.
Although some people aren't fans of the halving mechanism, I must say it is a decent exercise which helps maintain the inflation rate of the bitcoin.
Well, this was a nice lesson, thank you so much Prof. @pelon53, I learnt a lot