There are a lot of technical analysis tools out there for the analysis of crypto charts to study trends in order to know the right buy and sell points to maximize profit and cut losses. Of these, we have fundamental and technical indicators. Just like the word means, fundamental analysis has to do with analysis using basic information like the white paper and technical analysis has to do with studying price patterns and market movements.
Vortex Indicator is a technical analysis tool developed by Etienne Botes and Douglas Siepman in January 2010 based on the work of J. Welles Wilder. Upon inception, the Vortex indicator can be said to be a reliable technical analysis tool that can be used to spot market reversals, identify the start of trends and produce accurate buy and sell signals by being trend following. We can however say that being only 10 years old, the vortex indicator is still young but has proved to be a useful technical analysis tool.
As we know, in the market, there are generally two trend movements, the uptrend or positive movement and the downtrend or negative movement. The Vortex Indicator operates by plotting 2 oscillating lines, one describing a bullish movement (positive trend movement) and the other describing bearish movement (negative trend movement). The indicator works using the 2 oscillating lines constructed from the last 2 periods.
One of the oscillating movement describing a positive movement is obtained when a high comes after a low. The length difference between the current high and previous low is the positive line. On other hand, the second line which is obtained as the length difference between a current low and a prior high describes a negative movement.
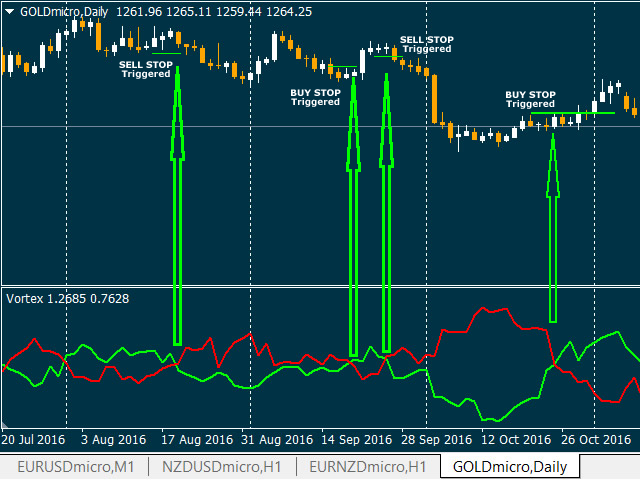
Most traders simply use the intersection of the 2 oscillating lines as enter (buy) and exit (sell) signals. However, there can be different buy and signals depending on the nature of the market and the timeframe used. Most traders use crossing of the two oscillating lines in a sense that a buy signal is when after the 2 lines intersect, the blue line indicating a bullish movement moves across the red line indicating a bearish market. This buy and sell signal is mostly used over 1-day or 1-week timeframes. In short, the trend line on the top after an intersection mostly indicates which signal is observed.
However, in an instance where a trader is to use a shorter time-frame like 1-hour, even though the buy signal remains the same, the sell signal is not. In this case, a buy signal is observed when the blue line indicating a bullish movement touches a resistance line drawn on the highest point of the positive trend line.
Calculations of the Vortex Indicator
As I said earlier, the Vortex Indicator consists of 2 lines a blue positive VI line and a red negative VI line upwards and downwards above and below each other. Hence we can calculate the upward or downward movement.
• Upward movement can be calculated as the difference between current high and previous low( Current high minus previous low).
• Downward movement can also be calculated as the difference between a current low and a previous high (current low minus previous high).
To calculate the period, we can use this expression:
For a positive Vortex Indicator movement of say 28 periods, VM28+ = 28-period sum of VM+
For a negative Vortex Indicator movement of say 28 periods, VM28- = 28-period sum of VM-
For the True Range we calculate as:
• Current High - Current Low
• Current High - Previous Close
• Current Low - Previous Close
A true range of 28 periods is given as TR28 = 28-period sum of TR


Whether an indicator is reliable or not has to do with the ability of the indicator to produce accurate results. It important to note that all indicators are vulnerable to whipsaws and at some point give false signals and the Vortex Indicator is not an exception, which is why it is most reliable when used with other indicators.
If you ask me, the reliability of this indicator depends on a lot of things, the sensitivity being one of the most important. But there must be something that influences the sensitivity. Yes, there is. The timeframe setting of the indicator. Increasing the timeframe settings to higher times decreases the chances of false signals but the disadvantage is that there’ll be lower frequencies of crossovers or intersections of the oscillating lines and therefore lower buy and sell signals.
Also lowering the timeframe to shorter times will generate more buy and signals and more false buy or sell signals will not conform to market trend. To reduce the chances of lower false signals, it is best to use the Vortex indicator with other trend-following indicators like the MACD indicator. The 3 moving average of the MACD indicator lowers the false signals of the whipsaw-prone Vortex indicator. Signals are most reliable when many of these other trend-following indicators give the same signal at a time.


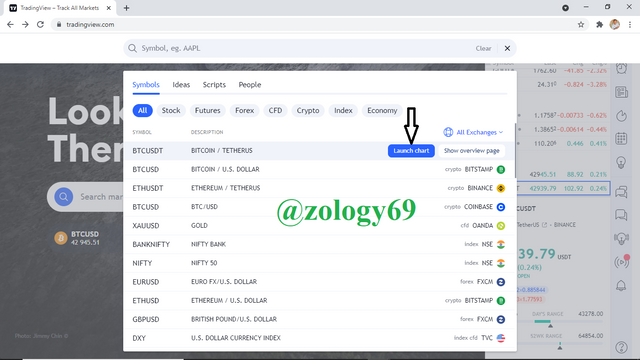
• To access my trading chart, I first launch tradingview, search and find the crypto of interest and I click load chart. Then the trade chart I want to monitor loads. In my case, I select BTC.
.png)
screenshot taken from tradingview
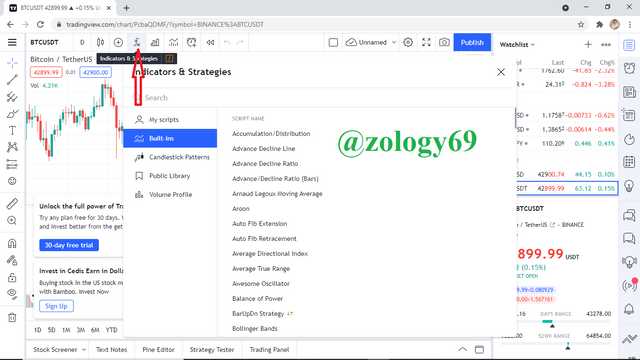
• To show indicators, I click on Indicators button here to show a variety of technical analysis indicators.
.png)
screenshot taken from tradingview
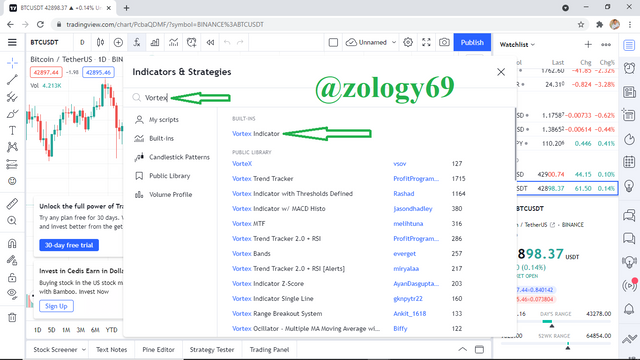
• To find the Vortex Indicator, I search Vortex Indicator in the search space provided in the pop up and I select the Vortex Indicator in the results.
.png)
screenshot taken from tradingview
Most indicators work best for different traders under different parameters or settings. For the Vortex indicator, like I mentioned earlier, the best parameters will depend on what the trader needs or intends to do.
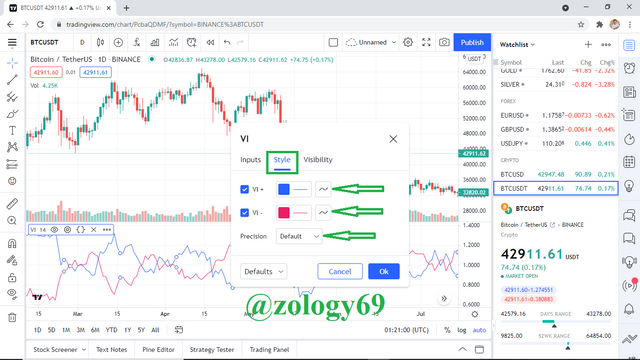
As for the color, most people normally use blue for the positive (+ VI) and red for the negative (- VI) and so that would be the recommended line color under style setting.
For signals, If a trader wants the quickest signals, it is recommended to set the period or length to shorter periods or lengths. A disadvantage of setting to shorter period is that as more signals are generated, most of the generated signals are going to be false signals. On the other hand, traders who want to minimize false signals and get more accurate buy and sell signals will consider the best setting to be at higher periods.
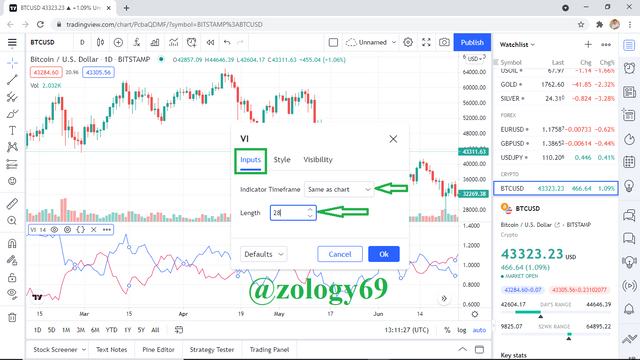
Most traders also usually use a 14 or 28 period configuration for the Vortex Indicator. Longer period settings are ideally less vulnerable to whipsaws. If you asked me, I would say the best and recommended parameters depend on whether you want faster but noisier signals or lesser but more accurate signals. Me, I’m okay with less signals if that means more accurate signals. For that reason, I’ll configure my Vortex Indicator to a 28 period or length. This is how I input my recommended parameters.
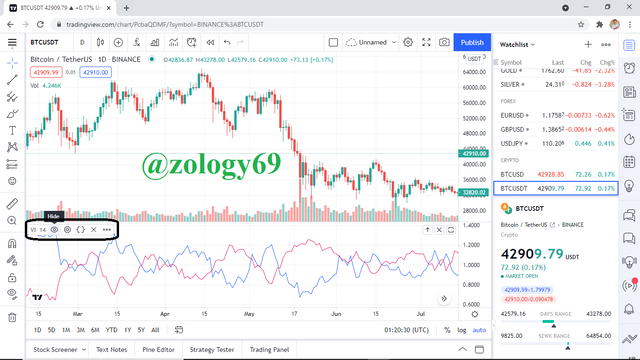
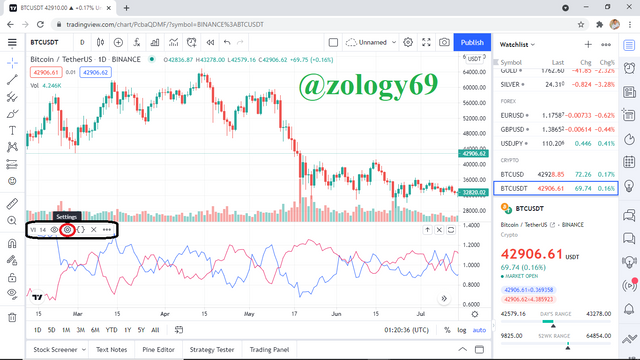
• I hover my mouse over the VI indicator sign to expose some setting icons
.png)
screenshot taken from tradingview
• After I have successfully added my indicator, I use the gear icon next to the eye symbol to enter into the indicator settings to configure my own settings.
.png)
screenshot taken from tradingview
• In the style settings, I make sure to set the blue line to indicate positive (+ VI) and the red line to indicate negative (- VI) and I keep precision at default setting.
.png)
screenshot taken from tradingview
• Under input, I make sure that I keep indicator timeframe as same as chart so that my indicator and chart move with the same timeframe and I set length or period to 28.
.png)
screenshot taken from tradingview
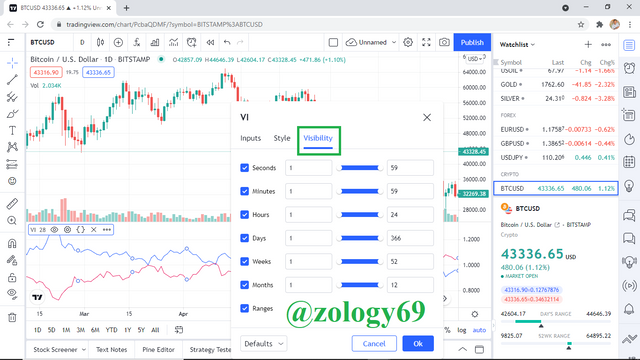
• At visibility settings, I set everything at defaults to move with normal time
.png)
screenshot taken from tradingview


Divergence in a simple sense means not occurring as expected. There are 2 types of divergence with the Vortex Indicator. This actually makes sense as divergence of any of the 2 types normally produces movements that do not agree with each other. The 2 types of divergence are:
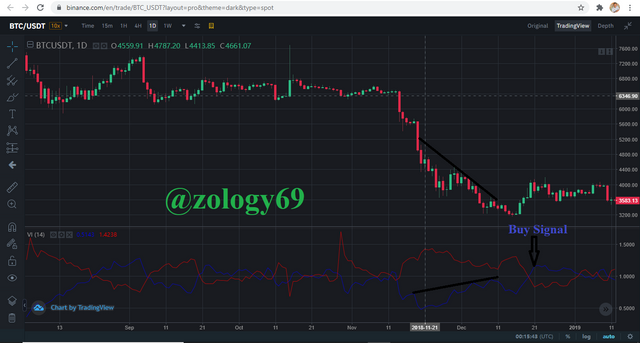
• Bullish Divergence: This normally occurs when the blue line indicating positive VI is experiencing a higher high whiles price movement experiences a lower high. So the blue line is moving upward indicating that a bullish market is favored yet we still see that the market is still in a bearish market. Hence, we observe a buy signal but price movement shows a downtrend.
.png)
screenshot taken from binance
From the BTC/USDT chart above, we can see that the blue positive (+ VI) line experiences a higher while price movement experiences a lower high. This is usually a buy signal as a bullish market is coming like seen in the chart.
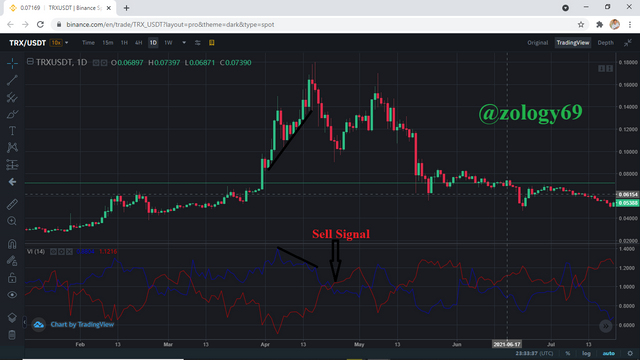
• Bearish Diversion: In this divergence, the bearish divergence is an opposite to the bullish divergence in a sense that in this case, price makes a higher highs while the blue positive (VI +) line makes lower highs.
.png)
screenshot taken from binance
From the chart above, we can see how the price movement of Trx and the length of the blue line indicating positive (+ VI) do not exactly tally. This is normally a sell signal as a bearish market is about to follow like we see in the chart.


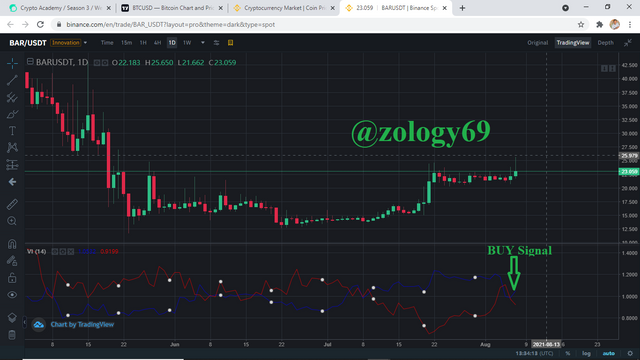
Buy Signal For BAR/USDT
.png)
screenshot taken from binance
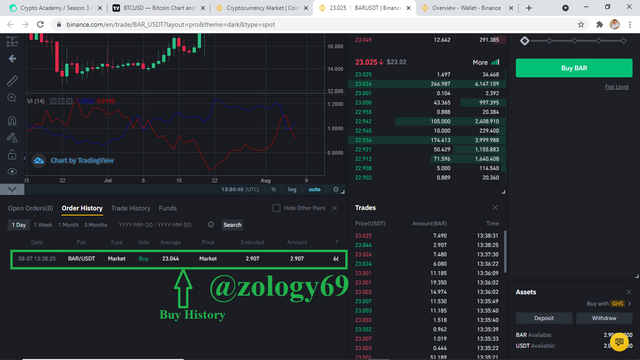
From the BAR/USDT chart above, we can see a clear buy signal where the blue positive (+ VI) line moves across the red negative (- VI) line. From my chart, the blue line rallied across the red line yesterday and so I am took my buy position today to get the most out of the buy signal. Below is a screenshot of my transaction history.
.png)
screenshot taken from binance
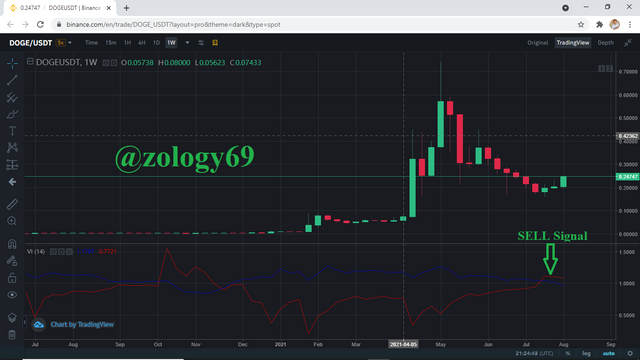
Sell Signal for DOGE/USDT
.png)
From the DOGE/USDT trade chart above, we see the red negative (- VI) line crosses the blue positive (+ VI) line which is a sell signal indicating a coming bear market and so I take a sell position to secure my investment.
Conclusion
I have learnt a lot from this lecture by professor
@asaj. There are a lot of technical analysis tools in the crypto and despite the young age of the Vortex Indicator, it has proved it can be relied upon. The important thing is to configure the indicator based on your needs and to use this indicator with other trend following indicators like the MACD indicator.
The Bullish and Bearish Divergence of the Vortex Indicator can sometimes signal a reversal trend following. The indicator shows us buy and sell signals, helps confirm trends and aids in identifying the start of trends. Also, the tight intertwining of VI lines normally indicates a market is not trending and so trend traders use this. It is important to note that just like other indicators, the Vortex Indicator is prone to giving false signals and whipsaws.


.png)
.png)
.png)
.png)
.png)
.png)
.png)
.png)

.png)
.png)


.png)
.png)
.png)


Hi @zology69, thanks for performing the above task in the sixth week of Steemit Crypto Academy Season 3. The time and effort put into this work is appreciated. Hence, you have scored 5.5 out of 10. Here are the details:
Remarks
We were hoping to see more depth and originality.
Downvoting a post can decrease pending rewards and make it less visible. Common reasons:
Submit
Hello professor @asaj, thanks for reviewing my assignment but you wrote 5 instead of 5.5 as my total score.
Downvoting a post can decrease pending rewards and make it less visible. Common reasons:
Submit