Graphically, explain the difference between Weak and Strong Levels. (Screenshots required) Explain what happens in the market for these differences to occur.
To call a resistance or support level strong or weak, we consider how reliable the said level is when it comes to anticipating price behavior. A point that barricades price several times resisting movement above or below it, is considered a strong resistance or support level respectively and one that resists price a few times but easily gets broken is called a weak level of resistance or support.
Strong Levels
Strong levels strongly resist price movements above or below them. Drawing a strong level as a horizontal line will see price touching said horizontal line several times but not crossing or breaking it. The more price tests a support or resistance, the more significant and reliable the resistance or support level is. The driving force of strong levels is the large volume of buy and sell orders placed at these points. The execution of these orders liquidates the market and causes pressure to drive price in the opposite direction once price reaches these levels.
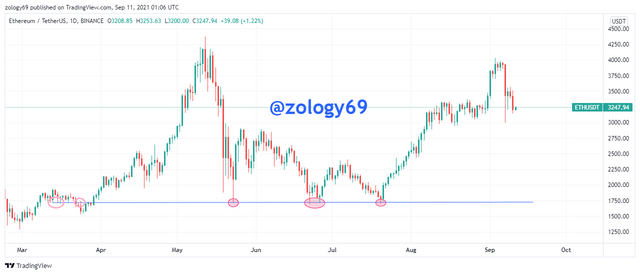
In the 1-Day ETHUSDT chart above, we see how price moves to test the level several times as both resistance and support and how this level continues to resist being broken as price moves in the opposite direction again after reaching this level.
Weak Levels
Contrary to strong levels, weak levels weakly resist price movement and are not as reliable. Just like with strong levels of resistance and support, weak levels are also influenced by pending orders placed at this level, this however in smaller volumes that is not able to overcome market pressure and is broken or crossed easily. Weak levels normally do not resist price many times before they get broken. After about 2 times of price testing them, they normally get broken.
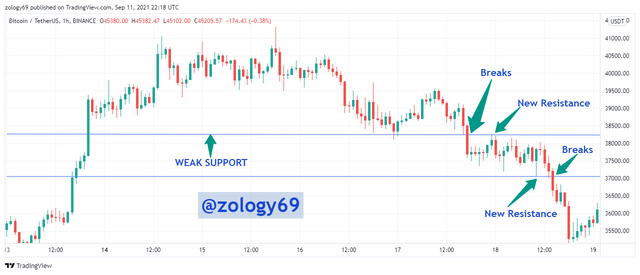
In the 1-hour BTCUSDT screenshot above, the level resists price movement only a few times before it gets broken. After price touches this level a few times, the level is broken as price moves across it.

Explain what a Gap is. (Required Screenshots) What happens in the market to cause It.
In the markets, we observe fast price movements normally over major events like big announcements or news relating to a particular crypto. When these fast moves happen in a way that price moves sharply without trading occurring between or passing between certain price in between, a gap is said to occur.
When gaps occur, we observe a space between adjacent candles because the ending point of one candle is not the starting of another. The space represents a missing candlestick because of the price jump. Gaps occur when there is no one willing to buy or sell at a particular price. A gap up meaning there is nobody in the position and a gap down implies there is nobody in the position. Normally, gaps get filled some point later after they occur in the market.
One very important downside of gaps we need to know is how to causes slippage. Slippage is the price difference between and a set order execution price and the price intended or expected. When a market order executes at a price other than the set price, a slippage has occurred. Gaps can cause slippages which in turn affects the execution of stop and limit orders.
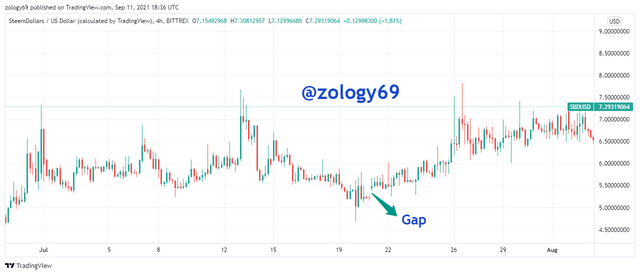
In the 4-hour SBDUSDT chart above, we see a gap as price moves from one trading price to the next without passing through the prices in between.

Explain the types of Gap (Screenshots required, it is not allowed to use the same images of the class)
Breakaway Gap
This gap type indicates a breakout or the beginning of large price movement creating higher highs or lower lows. The market usually changes direction from the previous trend after this gap occurs. The gap usually marks important resistance and support level for the coming market.
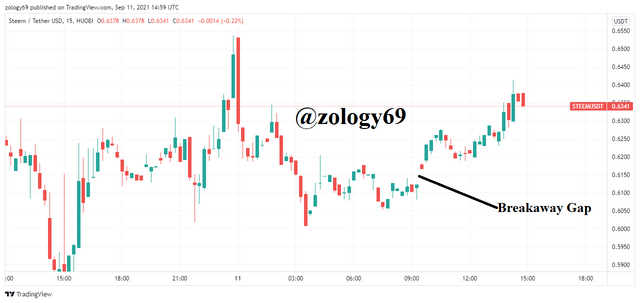
In the STEEMUSDT chart above, we see how a gap occurs at the start of a new trend(uptrend) following a range. Price trades in a range for a while and then the gap occurs breaking the range.
Runaway Gap
These gap form in the middle of a young trend that just started and suggests the trend will continue in its direction without a reversal. Because they’re in the middle of the market, they’re often confused with the other types of gaps and are mostly identified a while after they’re formed when trend continuation is positive. The gap level can also be considered strong resistance or support levels if correctly identified.
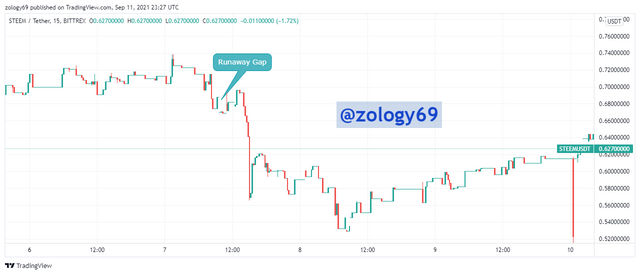
In the 15-minute STEEMUSDT chart above, a runaway forms in the middle of the downtrend and shows a continuation in the trend(downtrend).
Exhaustion Gap
This gap normally signals the ending of the current trend and the start of a potential new trend. It occurs near the end of large price movements with no new highs or new lows formed after the gap occurs so support and resistance levels are not really significant. Exhaustion gaps normally do not indicate price movement and are filled soon as price returns to cover the levels that were skipped by the gap. They are generally traded in the opposite direction.
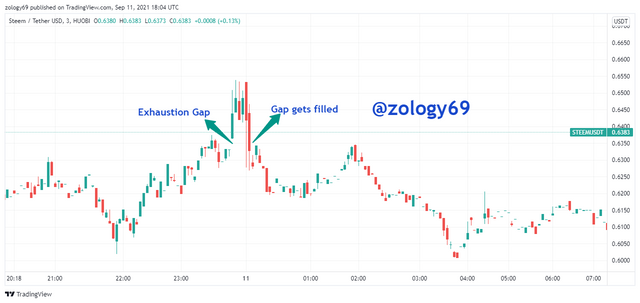
In the STEEMBTC chart above, an exhaustion gap forms which signals the potential coming of a small downtrend. However, the downtrend reverses back into an uptrend quick and the trend continues.

Through a Demo account, perform the (buy/sell) through Strong Supports and resistances. Explain the procedure (Required Screenshots).
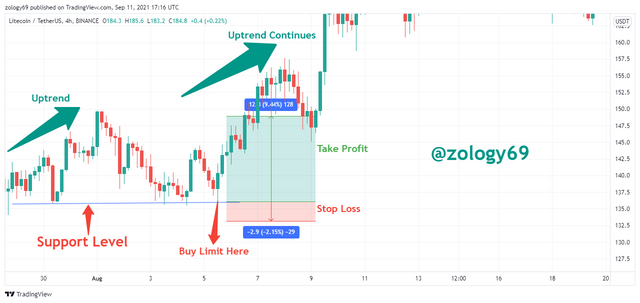
From the 4-hour LTCUSDT chart above, there is an uptrend but I want to buy at a cheaper price. I will be using strong levels in combination with a buy limit, stop loss + take profit for my trade. I place a buy limit near the support level below the current market because I believe price will retest support level before the uptrend continues. This will ensure that I buy the asset for cheaper and I set my stop loss below the support level and take profit above the resistance level with minimum R:R at 1:1, to cater for loss risk and take profit as price rises again in the uptrend continuation.

Through a Demo account, perform the (buy/sell) through Gaps levels. Explain the procedure (Required Screenshots)
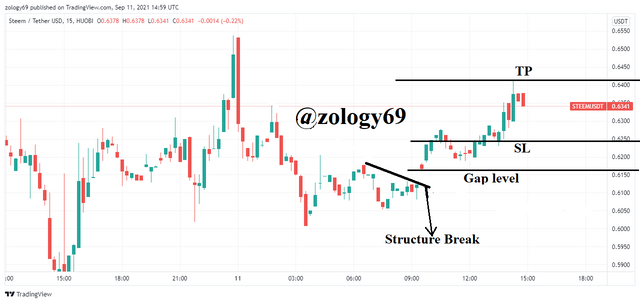
From the STEEM USDT chart above, after I observe a gap form at a certain gap level. The gap level is seen to break a resistance structure to form higher highers of the new young trend I set take profit at the next long candlestick after the gap and take profit above stop loss in a minimum 1:1 R:R ratio.

In the market, we’re always using indicators and trading strategies to maximize our profits and cut losses. One of the most basic and simple trading techniques is using resistance and support levels. We generally presume that a market will respect these levels but to prepare for risk, we still place stop loss and take profit around these orders. In the case of gaps, despite the fact that they’re not very commonly observed, identifying the type of gap can be really helpful in our trades if we do see gaps in the market.
CC: prof @allbert
Why did you use my exclusive tag for work that is not mine? That's spamming. Kindly remove it.
Downvoting a post can decrease pending rewards and make it less visible. Common reasons:
Submit
Thanks for brining this to my notice prof. My assignment has gone 2 days after marking without vote so I thought I used the wrong the wrong tag. I deleted the tag and tried to re-enter the tag again incase I misspelt the first time, and mistakenly used yours instead. Thank you again for pointing this to me.
Downvoting a post can decrease pending rewards and make it less visible. Common reasons:
Submit