Explain Leading and Lagging indicators in detail. Also, give examples of each of them.
Lagging indicators like the name suggests, are technical indicators whose movements follow price action. These indicators are trend-following, hence slow in responding to market moves and trends and will cause a trader to miss out on important moves in the market and enter or exit at the wrong points. Most of these indicators are moving averages calculated to follow the market using previous price action. Examples of lagging indicators include moving average, MACD and Parabolic SAR.
Their slow nature is not completely a disadvantage as they are less vulnerable to noise and whipsaws because they follow price. For this reason, they’re mostly used as confirmation tools to confirm signals of leading indicators. They come into play after a trend has already begun and helps traders identify the new trend and prepare their strategy for the trend.
Leading indicators on the other hand, are the opposite of lagging indicators. These indicators help traders anticipate market reversals using overbought and oversold regions. Their ability to predict price reversals is owing to the fact that they respond faster to price action than lagging indicators. Giving fast signals, they reduce the stop-loss size and gives the trader an early signal to enter or exit the market at the right times. Examples of leading indicators include stochastic indicator, RSI, OBV and ADX.
However, with their fast response time comes the disadvantage of giving false signals. They’re more prone to false signals. Leading indicators can give false signals in cases where price is just retracing previous levels before a trend continues again. False signals of this sort can be spotted by combining different indicators and ensuring that they’re in confluence.

With relevant screenshots from your chart, give a technical explanation of the market reaction on any of the examples given in question 1a. Do this for both leading and lagging indicators
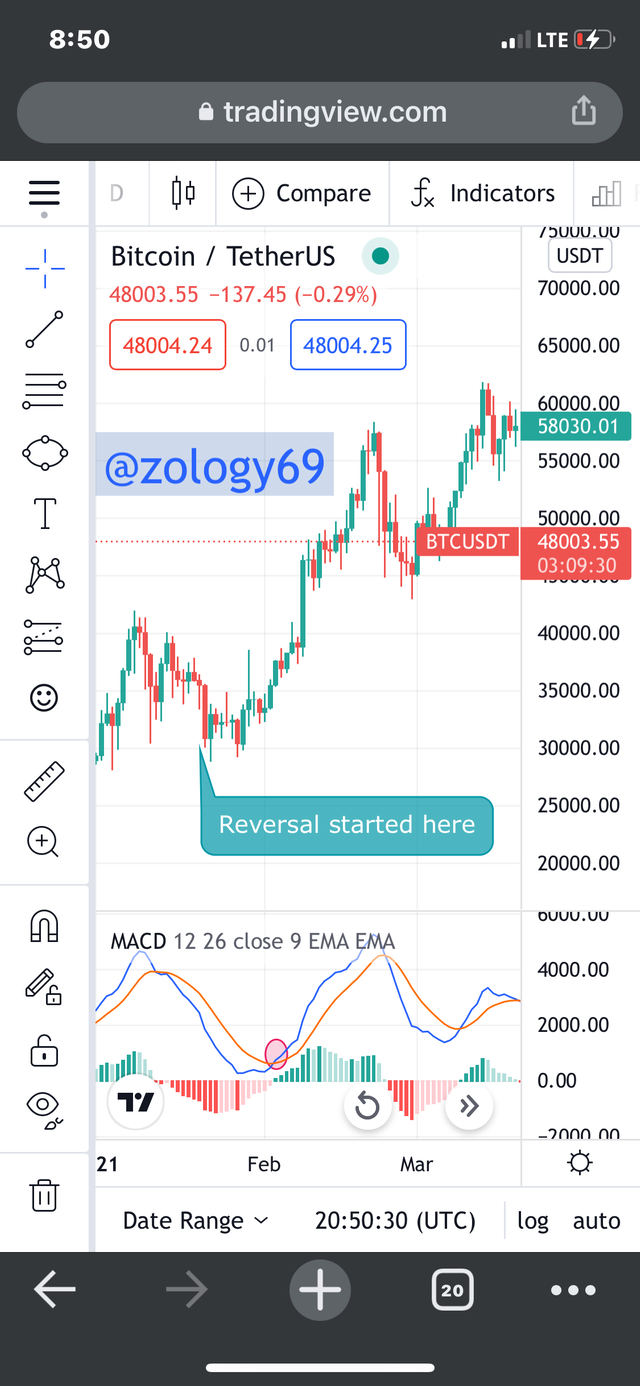
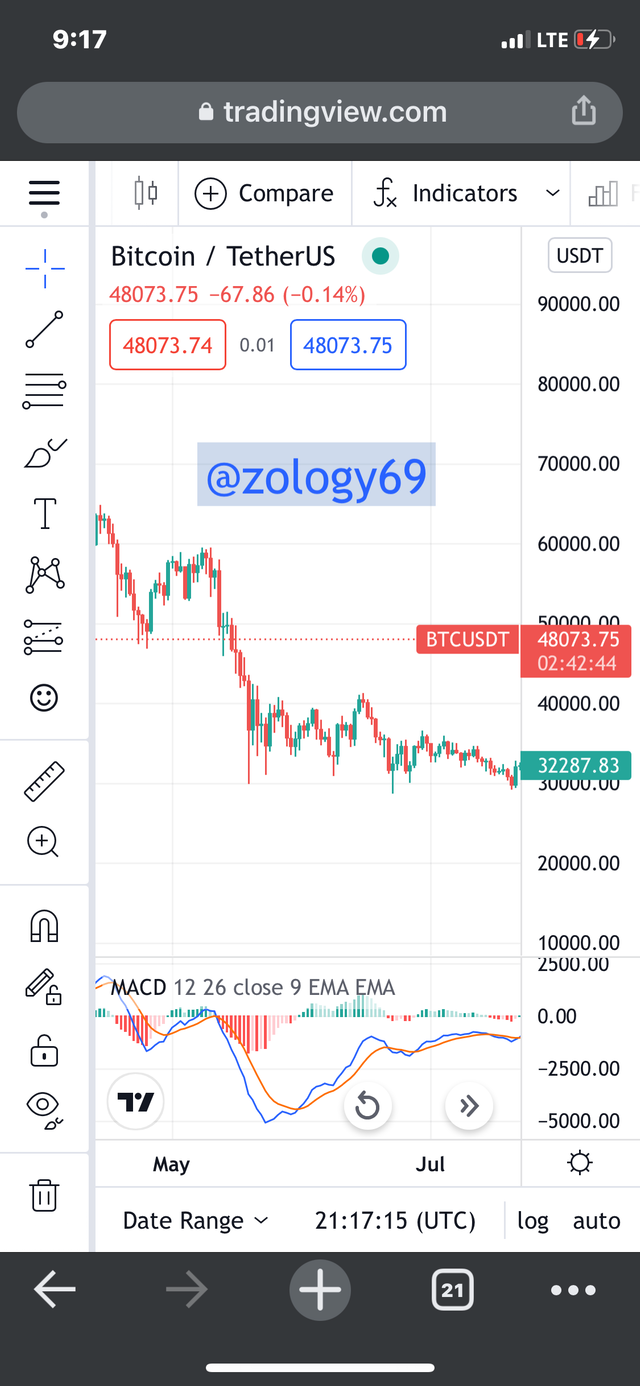
Looking at the 1-day BTCUSDT chart above, we see how the trend reversal started a while before the MACD gave a bullish signal. The MACD is lagging because its calculations follow price action (lags behind price action). A scalper who is using MACD indicator would have missed out on an early entry because of the late signal given by the indicator. A trader will therefore have to place orders with a wider stop-loss because the market is already in a developed trend and not at its beginning.
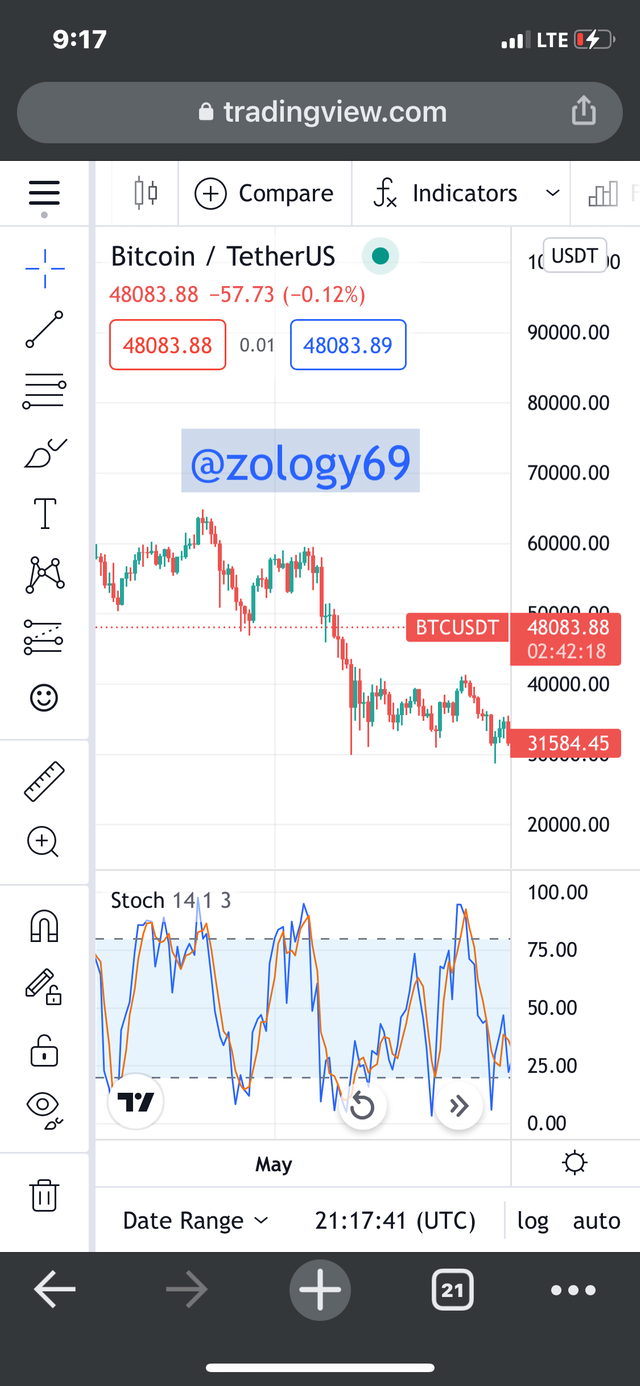
On the same 1-day chart above however, adding the stochastic indicator which is a leading indicator, we see that the stochastic indicator showed an oversold signal right before the reversal started. We see that there was confluence in price action and the indicator, as price reacted in the same direction as the indicator signal predicted. The stochastic indicator made higher lows as the bearish trend began. This allows us to make our entry or exit while the iron is hot.
What are the factors to consider when using an indicator?
Understanding Your Trading Style
In martial art, there is this saying that “a sword is as good the person wielding it”. In crypto trading, a trader is as good as their trading strategy is. Your trading style determines a lot including the indicator types you use, timeframe and others. A scalper generally trades on a shorter time frame while a wing trader trades on longer time frames.
Understanding The Market Trend
To apply your trading style, you need to know if a market is trending or in a range. Depending on whether a market is trending or in range, we require not only a different trading strategy but different technical indicators. A trending market requires trend-following indicators like moving averages while volatility and momentum-based indicators are more suited for ranging markets.
Understand The Type Of Indicator
We need to consider important things about our indicator types like whether our indicator is leading or lagging to match with our trading style. A trader whose trading style requires that they get fast signals will be more inclined to using leading indicators while traders that prioritize long term and accuracy are best matched to lagging indicators.
Finding Confluence
Most indicators at some point give false signals. Because of this, we need to use other indicators to confirm the signals given by our main indicator. This type of agreement or conformation is called confluence. There will be even more confluence if price action agrees with our indicator signal by moving in the direction. The more confluence there is the greater the chances of effectively applying the technical indicator.
Explain confluence in cryptocurrency trading. Pick a cryptocurrency pair of your choice and analyze the crypto pair using a confluence of any technical indicator and other technical analysis tools. (Screenshot of your chart is required ).
Due to the tendency of many indicators to give false signals, we need some kind of agreement or consensus among technical indicators as well as conformance of price in the direction an indicator signal. When different indicators used together give the same signal, there is said to be confluence. We only place trades when there is confluence among indicators since trading on false signals can cost us so much loss. The greater the confluence, the more confident and effective we are about our technical indicators.
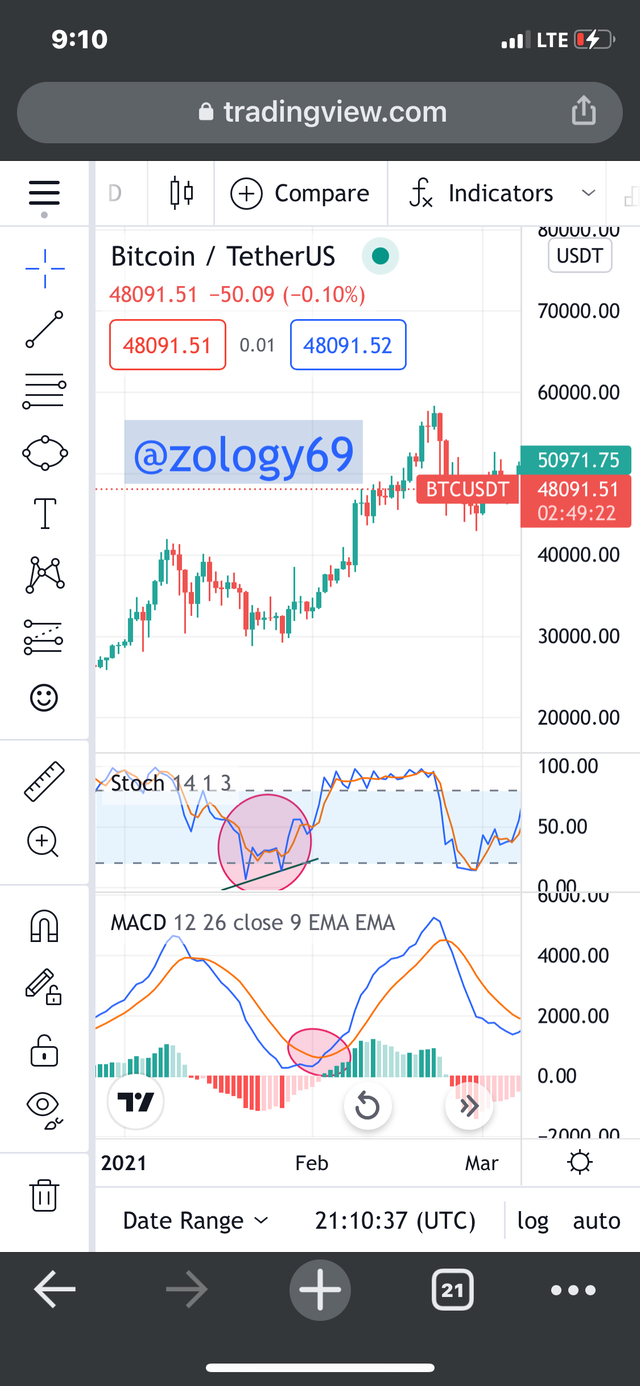
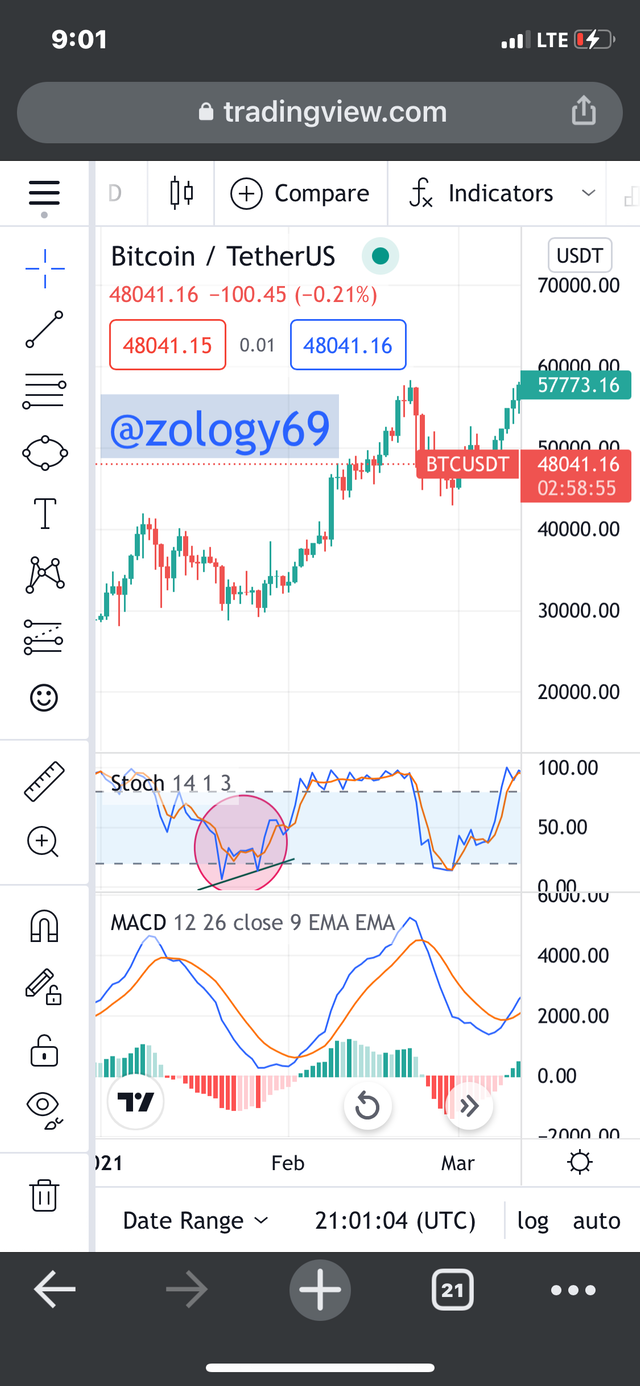
In the 1-day BTCUSDT chart above, there is confluence between the stochastic leading indicator and the MACD lagging indicator. A while after the stochastic indicator showed an oversold signal signaling a potential trend reversal, the MACD indicator confirms the reversal when the blue line crosses over the yellow line, suggesting a bearish trend. Price movement is also in consensus with the signal of the two indicators as the reversal does happen.
Explain how you can filter false signals from an indicator
We have already established the fact that sometimes, even the most reliable indicators give wrong signals. False signals occur when an indicator predicts a wrong future move of price of an asset. When the signal given by an indicator doesn’t conform with the anticipated market move, the indicator is said to have given false signals.
To avoid false signals, most traders use a mix of indicators to check each other for signal confluence, hence detecting whipsaws. When we use indicators together, we compare the signals given by each of them to determine if one is giving a signal contrary to the other signals or price action: such a signal is most likely to be a false signal and is ignored.
False signals can be caused by timeframe lags, hence the problem of false signals for some indicators reduce when we configure the timeframe. Most indicators give fast signals with many false signals at lower timeframes, but perform better with more accurate signals at higher timeframes with a side effect being that at higher timeframes, their signals become a bit laggy and slow. After adding an indicator, the timeframe and period of the indicator can be assessed by clicking on the gear icon representing settings, and switching to input settings, and timeframe.
.png)
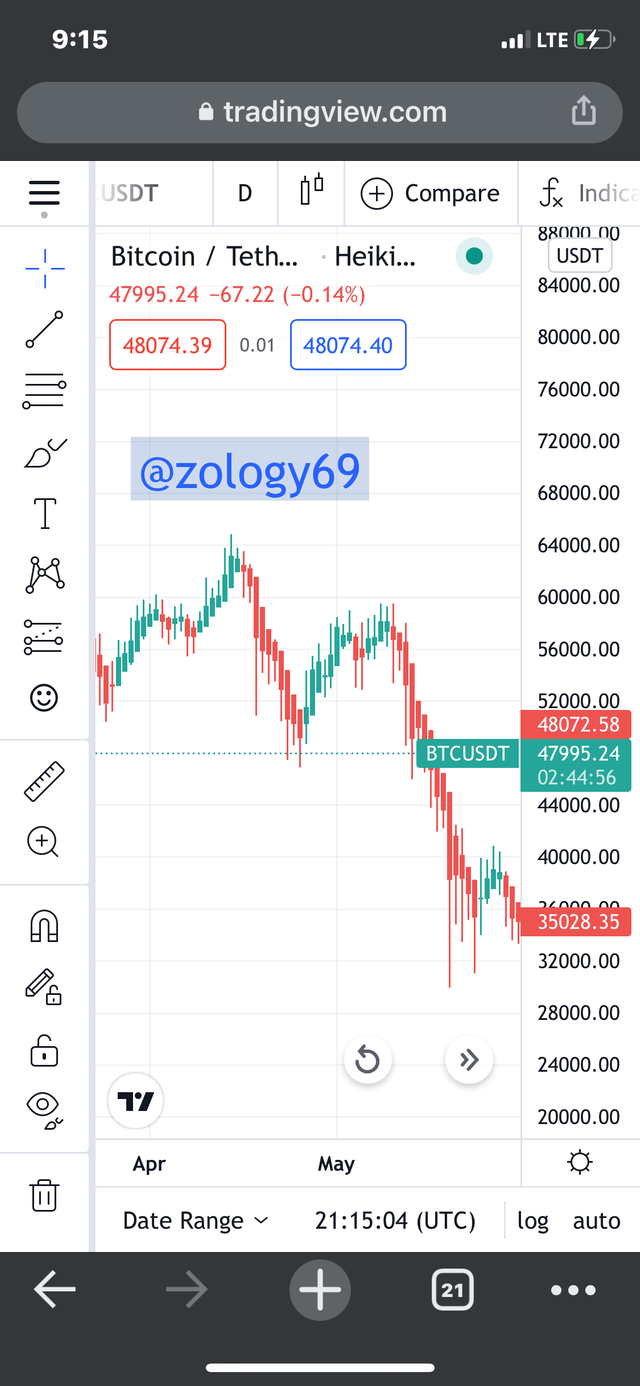
Removing noise by using candlestick averages is also an effective way to filter out false signals. Averaging candlesticks eliminates noisy intraday fluctuations in price, making it clearer and easier for technical indicators to read and anticipate price movement. Charting methods like the Renko chart and Heikin-Ashi chart perform very well in cancelling noise and can be used with indicators like the DMI and RSI.
Explain your understanding of divergences and how they can help in making a good trading decision. Using relevant screenshots and an indicator of your choice, explain bullish and bearish divergences on any cryptocurrency pair
Divergence occurs when price action and the technical indicator signal does not conform or agree. When price moves opposite to the move anticipated by the signal of a technical indicator, divergence has occurred. In both cases of bullish and bearish divergence, price does not move in the direction of the technical indicator. A divergence can signal that a trend is ending as there is about to be a possibly trend reversal.
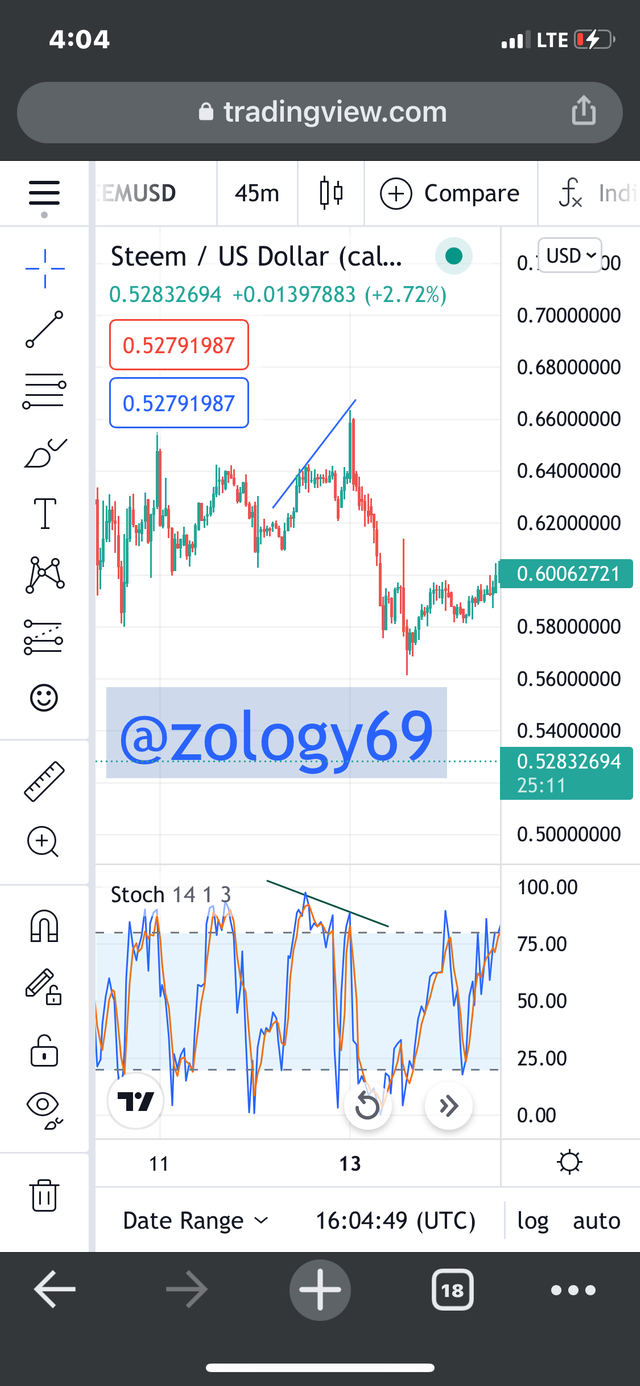
In the steem/USD chart above, we see a bearish divergence as price makes higher highs while the stochastic indicator makes lower highs. This hinted that the bullish trend is weakening and a possible reversal is about to happen. The reversal indeed happens as seen in the chart. Traders who observed this bullish divergence could’ve placed their sell orders to take profits before the bearish phase comes.
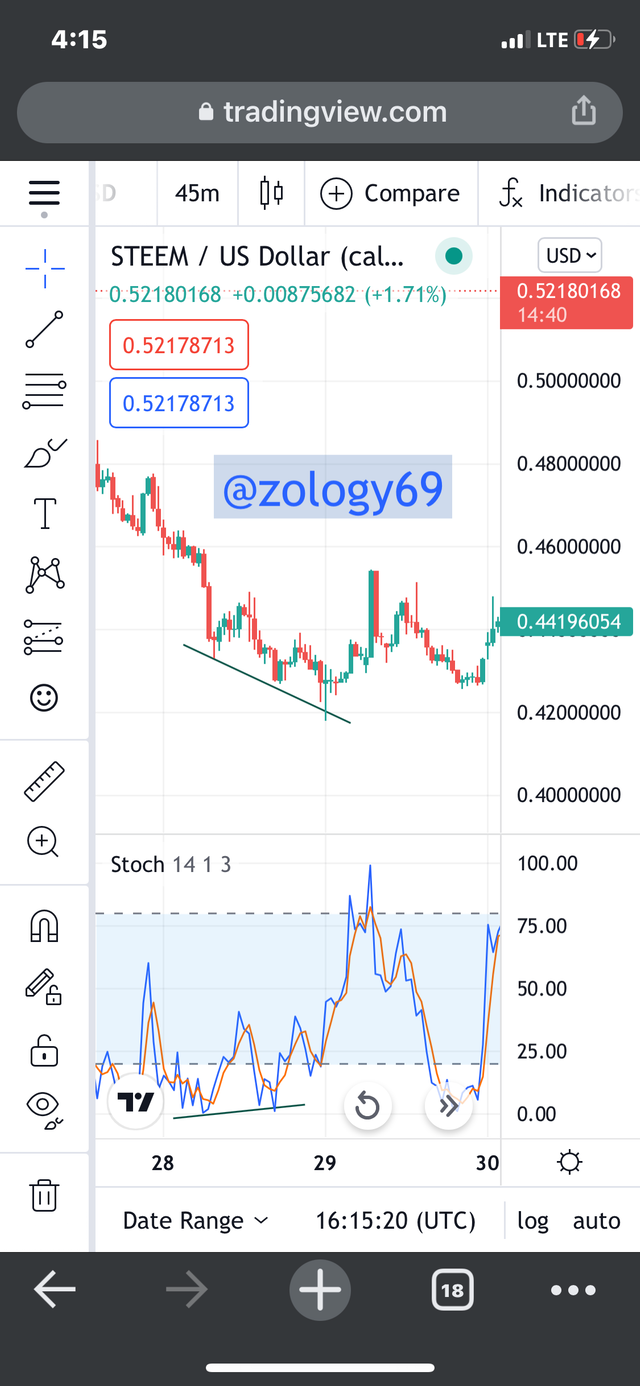
Again, in the 45-minute Steem/USD chart above, a bullish divergence is observed as we see that as price makes lower lows, the stochastic indicator makes higher lows. This bearish divergence hinted on the potential coming of a bearish trend, which actually happens as seen in the chart. Traders who observed this bearish divergence could’ve placed buy orders at low prices in anticipation for the coming bearish trend, to make profits.
Technical indicators are essential in the success or failure of crypto trading and knowing the types of indicators will go a long way to improve our trade success. Leading indicators are best for the fast signals they provide. We should not forget that these fast signals come with a lot of false signals.
To filter out false signals, we can use a mix of indicators together for confluence or we can reduce noise by using candle averaging charts like the Heikin-Ashi chart. We can also reduce the chances of an indicator giving false signals by adjusting the timeframe or period settings.
Lagging indicators known for being less vulnerable to whipsaws lag behind price, and generally are used to identify trends after they start. They are normally used as confirmatory tools to confirm signals given by leading indicators.
I really enjoyed this lecture and I hope I covered everything teacher is looking out for.
CC: prof @reminiscence01
Hello @zology69, I’m glad you participated in the 4th week Season 4 of the Beginner’s class at the Steemit Crypto Academy. Your grades in this task are as follows:
Recommendation / Feedback:
Thank you for participating in this homework task.
Downvoting a post can decrease pending rewards and make it less visible. Common reasons:
Submit
Thanks for the review prof
Downvoting a post can decrease pending rewards and make it less visible. Common reasons:
Submit