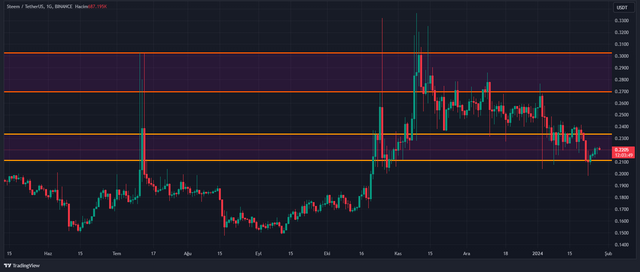
Hello again. I shared a Steem chart about three months ago. A strong resistance area has formed in the Steem price in the 0.18-0.2 price range. The transaction volume on Steem increased significantly in the three-month period. Binance, Bybit, HTX etc. Futures trading started on stock exchanges. We can expect sharp movements in the 0.22-0.32 price range in the coming period. When I trade, I usually follow the chart on the daily time frame. I will share with you the current chart I follow.
Data from tradingview site. On the daily time frame, I used price data from Binance Exchange.

The price is in the supply-demand zone in the 0.21-0.23 price range. We can follow the price of $0.15 in possible price drops. We will follow the 0.26-0.3 supply-demand zone in possible increases. For a sustained price increase, we can expect a resistance level to form at $0.33 and above.
My previous Steem chart analysis:
https://steemit.com/steem/@anadolu/steem-chart-analysis
This is not a bullish or bearish signal. And this article is not investment advice. You should evaluate your investment decisions based on psychological and financial opportunities. It would be more useful to examine this publication as an educational study. See you in new articles, stay tuned.
Congratulations, your post is upvoted by CCS curation trail from CCS - A community by witness @visionaer3003.
Vote for @visionaer3003 as witness.
Downvoting a post can decrease pending rewards and make it less visible. Common reasons:
Submit