Bitcoin selling behavior
As Bitcoin's price performance continues to impress, it has become increasingly important to evaluate the reactions of different market participants to price increases. In general, we differentiate between long-term holders (LTH) and short-term holders (STH). The former have a coin age of more than 155 days, and the latter have a coin age of less than 155 days.
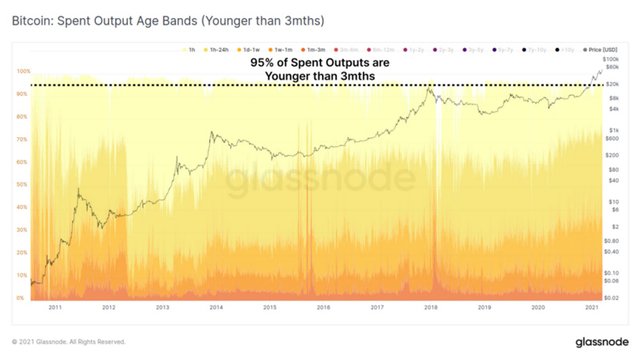
We are based on the observation that most of the liquidity stock that is traded on a daily basis are young coins that have moved recently in recent months. The image below shows the age of the coins, which shows that in most cases, more than 95% of coins are less than 3 months old (the white space at the top is coins that are more than 3 months old).
Conversely, once a coin crosses our 155-day threshold and becomes an LTH-holding coin, it is less likely to be spent based on statistics, and will usually only be raised during periods of high volatility and prices in a bull market.
Coin age and payout graph
We often need to make assumptions about the different consumption behavior of LTH and STH in order to interpret transaction data on the chain accurately.
- Our LTH assumes that they have a sufficient understanding of the Bitcoin protocol and have a high level of trust in the asset. They tend to buy coins at low prices in a bear market and realize profits in a bullish market.
- We assume that STH is more likely to be a new market participant and a trader who transfers value between exchanges. Therefore, this group is more sensitive to price fluctuations and therefore more likely to spend coins immediately after the last transaction.
- During the bull market, LTH will transfer a portion of the BTC wealth to the STH, while some of the STHs collect their coins and convert their coins into LTH.
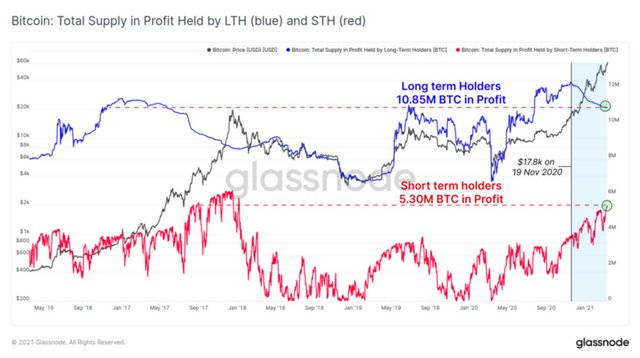
The image below shows the number of profitable coins held by this entity. Given that the price of BTC is effectively at historical highs, this accounts for almost the entire supply (after filtering out known balances of exchanges and other entities).
We can see that since late November 2020 ($ 17,800), LTH has gradually sold around 1.4 million BTC (blue, smooth downtrend), and STH has accumulated these coins and assumed volatility (Red, volatile uptrend) ), this is typical of the bull market.
Compared to the 2016-17 cycle, current holdings of LTH and STH are comparable to around mid-2017. This LTH cycle actually originates from a higher base (holding more coins) than the previous cycle. This is because miners sell more, and this too is a long period of accumulation that has experienced a market decline since 2018.
Real-time charts of currencies that hold gains and losses
This gives an illustration, the current STH demand is still strong, LTH is gradually releasing coins, and the speed of coin issuance is slowing down. However, it should be noted that there is still a larger supply in LTH's hands. This is good news in terms of liquidity, but as prices rise further, or follow a more sustained correction, this could also become upward resistance.
Circulating supply dynamics
In terms of global supply, the mother wave theory puts forward a different view of the supply ratio that UTXO has over its lifetime. When old coins are spent realizing a profit, they are changed from old coins to young coins, and their useful life is reset to zero.
The holding wave chart below shows the proportion of supply circulating for less than 6 months. The height of this ribbon will increase with the proportion of more old coins (old coins are converted to young coins), and decrease as more coins are held for longer (younger coins become old coins).
At all important peaks, the circulating supply for less than 6 months continues to increase, reaching a peak of 50% or more. In the current bull market, around 35.9% of supply is in circulation less than 6 months, indicating that on the contrary, a large number of currencies are still held firmly by LTH.
 Holding a wave chart
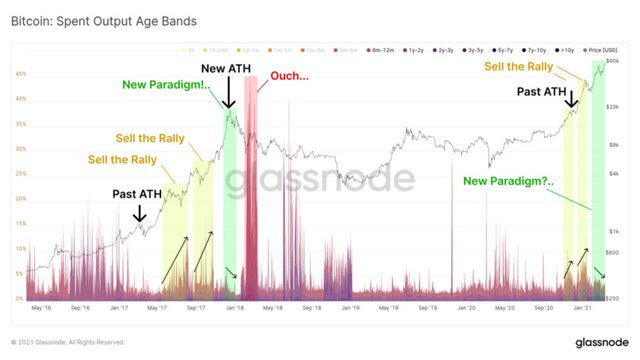
Returning to the issuance and output age group (SOAB), this time we will not look at all young coins, only the selling behavior of LTH coins over 6 months old. This chart shows us an increase in LTH selling, which is usually associated with a bull market rise or extreme volatility in a bear market.
If we set our sights on a bullish market at the end of 2017, LTH has gone through three stages:
Sell on up: The price is up more than the previous ATH, and LTH realizes the profits in a strong market. SOAB performance, prices underwent a major correction (yellow), and spending increased.
Peak selling: Compared to the previous two increases, the peak of the last increase was marked by a decrease in LTH spending. This indicates that a new situation has emerged. Will our situation this time be the same as before?
Dropped callback sales: After the first bear market fell from US $ 20,000 to US $ 6,000, LTH was sold to ATH, as the price went up again to US $ 10,000, but the current price was halfway high.
 Graph of old coin selling situation
For the 2020-21 bullish market, the initial up-sell phase actually started relatively early as the price approached $ 20,000 earlier. Similar behavior occurred in the second phase, where the price increased by US $ 42,000 and was then revised to US $ 29,000 in January.
In the most recent revision, it fell from US $ 58,000 to US $ 43,000, and has now increased to US $ 61,300 on ATH. LTH's sales behavior is actually reminiscent of the peak of 2017. We can see that over time, sales decreased, and the size was lower. In fact, across all bull markets, LTH sales are significantly lower than the 2017 bull market.
The LTH consumption behavior is of course similar to the last part of the 2017 bull market. Remember, however, history must be combined with current market dynamics. For example, a development unique to this cycle is the explosive growth of crypto finance, lending services, and risk hedge derivatives markets (including centralized and decentralized forms).
Apart from introducing institutions to the market, as holders find new ways to obtain liquidity and risk management tools without wasting their currency, the consumption behavior in this cycle will have unique characteristics.
Weekly Topic: ATH Impact Miner Income
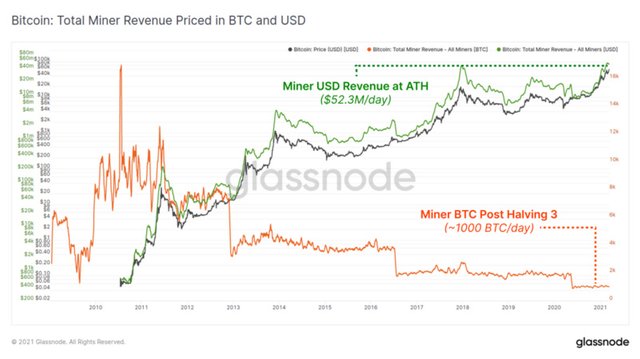
This week, Bitcoin miners' earnings hit a record high of $ 52,300 per day. Though block subsidies will be cut in half by May 2020. Since miner fees (CAPEX and OPEX) are generally denominated in official currencies, this is of positive significance to ensure the continued security of the Bitcoin protocol.
Bitcoin mining machine revenue chart
In the post-half era, total miners' revenue was typically around 1000 BTC / day, consisting of block subsidies (around 900 BTC / day) and transaction fees, which fluctuated between 75-125 BTC / day.
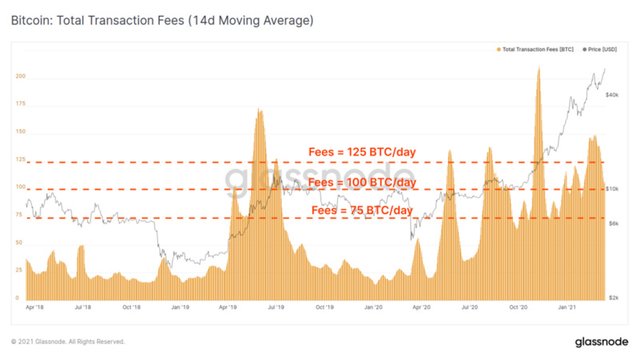
Real-time graph of total transaction costs
Payment of on-chain transaction fees related to exchange activity is also an attractive indicator that can track market trends and focus. Currently, global transaction fees associated with exchanges account for about 30% of on-chain transaction fees, and deposits account for about half, which is 14.65%.
It should also be noted that most exchanges use batch trading to make transaction fees more efficient. Therefore, although withdrawal transactions account for about 4.1% of the entire market fees, they may consist of a more dangerous combination, especially when compared to 14.65% deposit fees, the latter may be user-friendly transactions.