Hello and welcome to a BTC update in the daily chart,
On the higher time levels, the coin remains clearly pointing upwards. The January correction was caught at high levels (28,800). The bull flag, which was trained at the time, continues to offer good points of orientation in technical chart analysis.
In my experience, neatly drawn lines and channels are a key analysis of great importance.
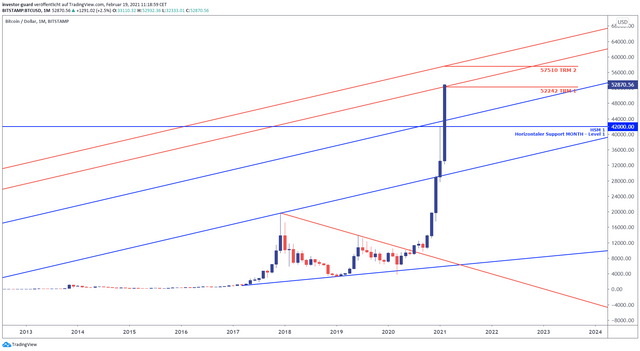
In the daily chart, Bitcoin is currently knocking on trendline resist 2 at USD 52,779. A clear breakout above 52779 can then bring the next higher projection level into play at USD 57135.
The monthly chart is also interesting. TRM 2 (Trend Resist Month 2) also waits at 57510 and forms what is known as a daily chart with the daily chart. Cross resistance.

On the bottom, my advice is to keep an eye on the slight volume points at $ 47779 / $ 46250.

Basically, the increase since the last interim low at USD 28,800 is quite "decent" again ... so, always be careful ...
As I said, I can still imagine a little air. In addition to the bull flag quoted above, a megaphone was also recently activated ... the first goals (61.8%) have almost been processed ... the 100% goal is waiting at USD 54851.

Bitcoin must avoid a relapse into the inner space of the megaphone. In my opinion, such a development can mark the beginning of a veritable setback.
Disclaimer:
The information provided here is of a general nature and not legal, tax or investment advice.