Hey friends hope you are well and welcome to the new update on NPXS token. The priceline of Pundi X token is moving within an up-channel since after mid of March 2020. Now finally the priceline has broken out the resistance of the channel. At this time the price action is likely to re-test the previous resistance of the channel as support.
If we take a closer look at the movement of the price action then it is likely to form another channel above the resistance of the previous channel.
A Cup & Handle pattern formation:
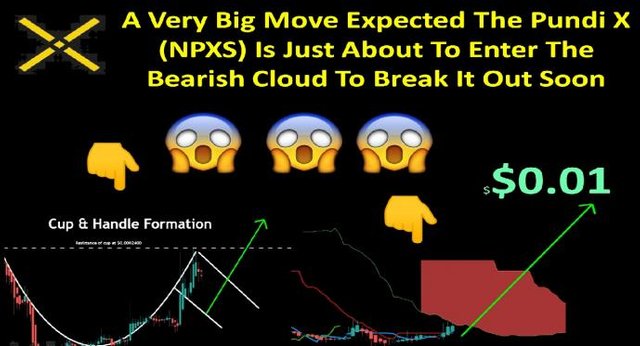
If we switch to the two-day chart then it can be easily observed that the price action of NPXS token has formed a cup and handle pattern. The resistance is at 0.0002400 btc. After the completion of the cup now the price action is completing the handle of this pattern. So far the priceline of Pundi X has been retraced up to 0.382 Fibonacci level. And this is the Fibonacci retracement from the bottom of the cup up to the resistance of this pattern. We can expect a pullback at 0.618 or up to 0.786 Fibonacci retracement level maximum. As the price action is retraced up to 0.382 Fib level therefore we can expect a bullish move at any time that can breakout the handle and the resistance of the cup as well.
Support of SMAs and a bull cross of 100 and 200 SMAs:
Ono the daily chart the price action has already broken out the 25, 50, 100, and 200 simple moving averages. Now finally we also have received a bull cross between the 100 and 200 simple moving averages. Now a complete opened alligator mouth by the simple moving averages is also formed that is another powerful bullish signal. So we can expect after some retracement the price action can be moved up for the break out from the resistance of the new channel and the cup’s resistance as well.
Click here to create free account on tradingview to watch and play the chart on realtime
The price action can enter in bearish cloud for a big breakout:
As in my previous article of Pundi X, we have seen that on the weekly chart the candlesticks are moving up towards the bearish ichimoku cloud. At this time the price action is having a correction rally. And on the weekly chart, it is retesting the conversion line as a support. Therefore in case of successful re-test, we can expect that the price action can enter the bearish cloud and once it will be entered in this cloud then soon it can reach up to the upper resistance of this cloud to make a big attempt for the breakout.
Conclusion:
From the mid-term to the long term the patterns and signals re bullish. But the priceline is also retesting the resistance of the previous channel as support. Therefore we should in case the priceline will be entered again in the previous channel then we should use its support as stop loss.
Note: This idea is education purpose only and not intended to be investment advice, please seek a duly licensed professional and do you own research before any investment.
Don't forget to follow my blog as below:
http://moontripplethree.blogspot.com/
