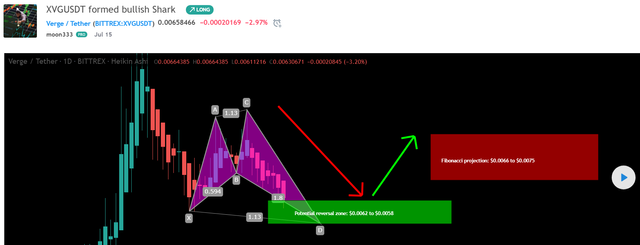
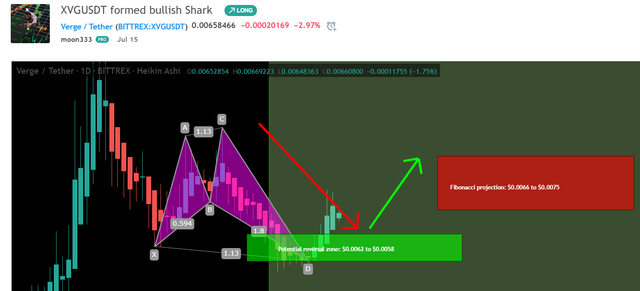
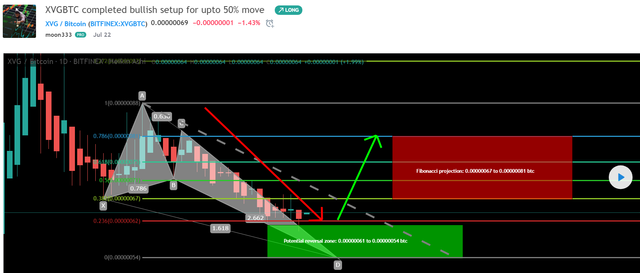
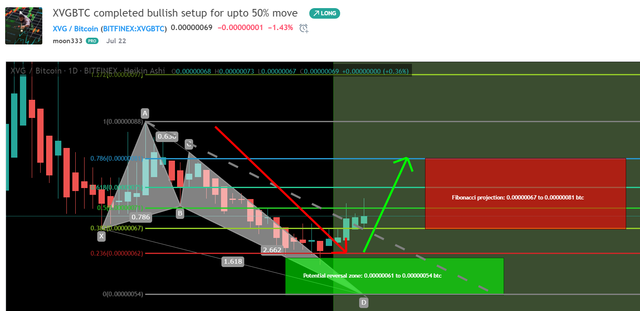
Hi guys and gals hope you are doing well and welcome to the new update on a Verge coin. Previously I shared some harmonic moves of the XVG coin and I told you that the verge coin has formed these bullish reversal patterns and it can be moved up from here. Finally, the priceline of XVG has started the bullish divergence from the potential reversal zones of these patterns as below:
XVG with US Dollar pair before execution:

XVG with US Dollar pair after execution:

XVG with Bitcoin pair before execution:

XVG with Bitcoin pair after execution:

The priceline is trying to breakout the SMA resistance:
A few days back on a two-day chart the price action of Verge coin broke down the 25 simple moving average support and now it is moving up again and trying to break out the 25 simple moving average as resistance. We can also observe that the 100 simple moving average is moving up to form a bull cross with 200 simple moving average. Once this cross will be formed then the price action will have more strong supports of SMAs.
The priceline is moving towards the next resistance:
After re-testing the previous support of $0.006 now the price action is moving to the next resistance level at $0.0075. If the price line will be able to break out this resistance then the next resistance is $0.0085 and then we have the key level resistance at 1 cent.
Now I would like to draw your attention towards a very powerful move by the price action of XVG coin. As we have already seen this action that If we place the Ichimoku cloud on a long-term weekly chart, then it can be observed that the price action was moving below the bearish cloud for a long time. But now the price action has entered the cloud and has attempted for the breakout. The lagging span of the Ichimoku cloud has crossed up the priceline and the conversion line has formed a bull cross with baseline just below the price action of Verge coin. At this time the priceline of XVG is moving between the resistance of the bearish cloud and the conversion line and using conversion and baselines as support. And as we already have seen that the priceline has taken bullish divergence from the harmonic patterns on the daily chart. Therefore we can expect that these harmonic patterns can be also helpful to push the price line of XVG to the resistance of the cloud to make another attempt for the breakout.
Click here to create free account on tradingview to watch and play the chart on realtime
Conclusion:
Even though the price action has started the bullish rally from the potential reversal zone of harmonic patterns but it is also trying to break out the 25 simple moving average resistance on the daily chart. If the price action of Verge currency will be failed to break out this resistance level then and we can also witness a rally to the downside up to the 50 simple moving average.
Note: This idea is education purpose only and not intended to be investment advice, please seek a duly licensed professional and do you own research before any investment.
