
Hi friends hope you are well and welcome to the new update on Sia coin. On 24th of June I posted two ideas one was Sia with US dollar pair and other one was Sia with Bitcoin pair both ideas executed successfully as below:
Sia with US Dollar pair:
Before execution:
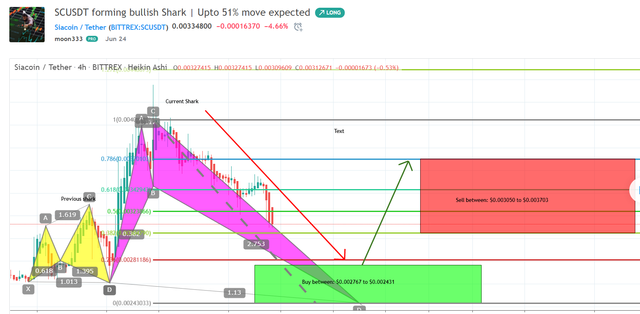
After execution:

Click here to visit this old article on tradingview
Sia with Bitcoin pair:
Before execution:
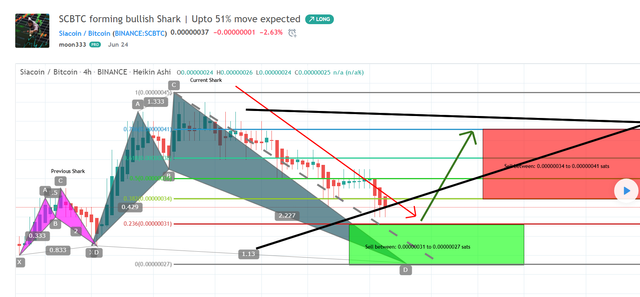
Click here to visit this old article on tradingview
After execution:
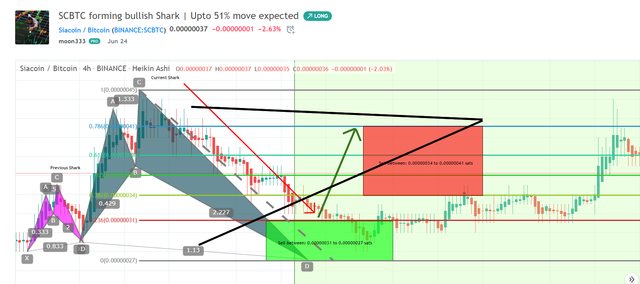
The new Gartley pattern:
After the above patterns the price action of Sia coin formed another Gartley pattern on 12 hour chart. After entering the potential reversal zone the price action is gearing up and at this time it has been projected between 0.382 to 0.786 Fibonacci of A to D leg.

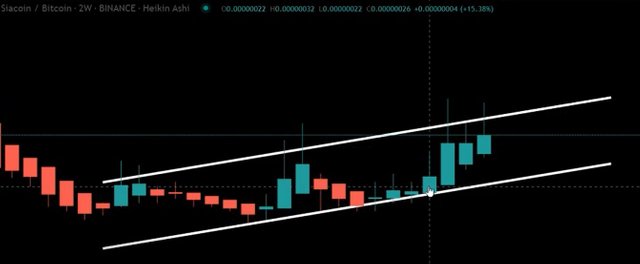
Big up channel on long term chart:
Now if we switch to the two-week chart then the price action is moving in an up channel. At this time the price action is at the resistance of the channel and already has attempted three times for the breakout.
A Big bearish Shark pattern:
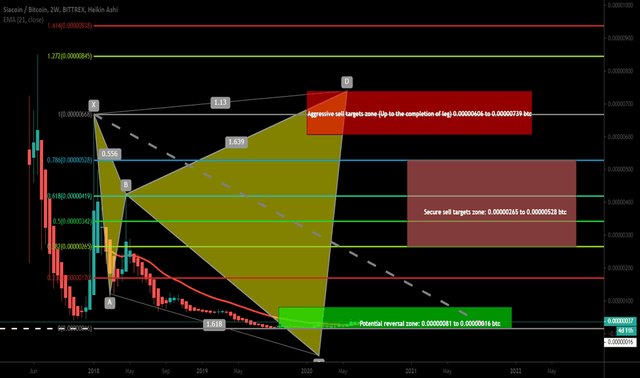
On the same two week chart the price action of Sia coin with Bitcoin pair is also likely to start the final leg of the bearish Shark pattern. At this time it is moving in the potential reversal zone. If this leg will be completed then it can be up to 4500% profit potential trading Idea. However, the price action has found strong support at 0.00000016 btc on long term, therefore I have defined the potential reversal zone up to this level and it should be stop loss for this long term high-risk high-profit potential trading idea. The targets are as below
Click here to create free account on tradingview to watch and play the chart on realtime
Potential reversal zone: 0.00000081 to 0.00000016 btc
Secure sell targets zone: 0.00000265 to 0.00000528 btc
Aggressive sell targets zone (Up to the completion of the final leg leg) 0.00000606 to 0.00000739 btc
The EMAs on long term chart:
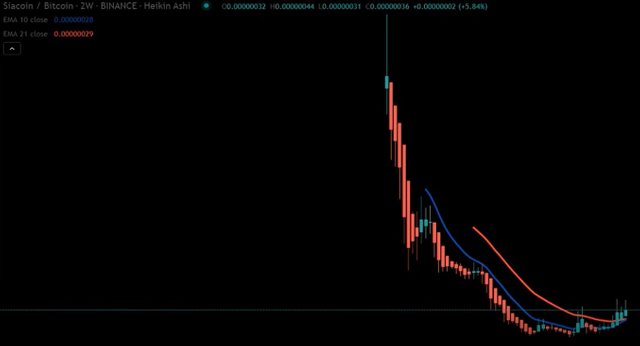
If we place the exponential moving averages with the time period of 10 and 21 then it can be easily seen that the price action has crossed up these both exponential moving average. And EMA 10 is likely to form a bull cross with EMA 21 as well. And this bull cross can produce another powerful rally. And the price action is having a strong support of these two exponential moving averages for the first time ever in the history of Sia coin as per Binance exchange.
Conclusion:
Even though the price action is facing the resistance of a very big up channel. However, recently it has also taken bullish divergence from the potential reversal zone of Gartley pattern on 12 hour chart. And having strong support of exponential moving averages on the long-term chart as well, Therefore there are strong chances that this time the price action will be able to break out the resistance.
Note: This idea is education purpose only and not intended to be investment advice, please seek a duly licensed professional and do you own research before any investment.
