Hi friends hope you are going well and welcome to the new update on Dash coin. Recently the Dash coin has completed the Shark pattern and after entering in potential reversal zone as per the Fibonacci sequence it took bullish divergence and moving up.
Support and resistance levels for Dash:
At this time the priceline of Dash coin is moving between the 60 dollar support and 85 dollar resistance level. If the $60 support level will be broken down then next support will be $38.16 and if $85 resistance level will be broken out then the next resistance level will be $100. This is also a strong resistance because the priceline is not able to breakout this $100 resistance since after it was broken down in August 2019. Then next resistance level would be at $130 and after that $170.
A big falling wedge pattern and volume profile:
On the long-term weekly chart the price action is moving in a falling wedge. In March 2020 the price action is bounced from the support and at this time it is moving at the center of the wedge pattern. If we watch the volume profile of the complete price action of Dash coin moving within this pattern then it can be easily seen that the point of control of the volume profile is at the same level where the price action is moving at this time. And this is the basic reason the price action is not moving up and down even it is moving around this POC level.
A big BAT move:
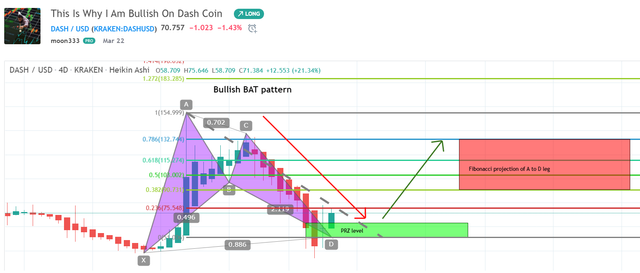
Now I would like to draw your attentions towards my post that I published on 22nd of March 2020. Where I revealed that on 4 day chart the price action of Dash coin has completed the formation of a bullish BAT pattern. Now from the potential reversal zone the price action has started moving up at this time it is moving above this PRZ level.
As per Fibonacci sequence of bullish BAT the buying and sell targets can be as below
Potential reversal or buying zone: $63.13 up to $51.45
Fibonacci projection or sell zone: $91 and ends up to $132.92

Click here to create free account on tradingview to watch and play the chart on realtime
Conclusion:
The price action has already bounced from the support of the falling wedge pattern. And recently it has taken another bullish divergence from the potential reversal zone of bullish Shark pattern. Therefore we can expect soon the price action will move more up on long term and it will enter the Fibonacci projection area of bullish BAT.
Note: This idea is education purpose only and not intended to be investment advice, please seek a duly licensed professional and do you own research before any investment.
