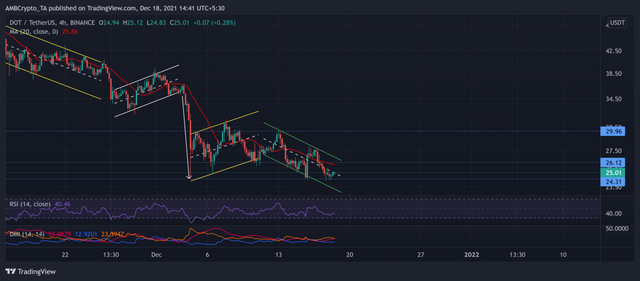
As pointed in the previous article, DOT continued its down-channel trajectory after the anticipated bearish flag breakdown.
This fall occurred after the bulls retested the $29.9-mark thrice since the beginning of the Month. The decline halted at the crucial $24.3 mark that the bulls have ensured for 17 weeks now. As a result, DOT found an oscillating range between the aforementioned levels.
DOT’s bearish streak continued to snowball as it poked its 14-week low on 17 December. Now, the current testing point for the buyers stood near the 20-SMA (red) at the $26-mark.
At press time, the alt traded 54.8% below its ATH at $25.01. The RSI moved sideways near the 40-level, revealing a powerful bearish impact. Further, the DMI reaffirmed the bearish vigor. However, the ADX displayed a weak directional trend for the token.