Hey Guys..!!
Meet again with me Wahyu Nahrul, This time I want to make a brief technical analysis of a cryptocurrency chart, the analysis I made is based on my experience and knowledge.
.png)
Alright, let's get straight into the discussion, happy reading!!

Bittorent (BTT) Analysis
Today, May 21, 2022, I will try to technically analyze the price movement of BTT.
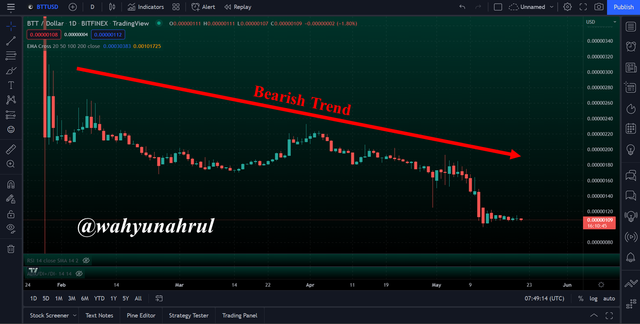
At the time this article was written, the BTT Token was undergoing a Bearish Phase, but the bearish phase that occurred in BTT was not as deep as other cryptocurrencies whose percentage exceeded our expectations.
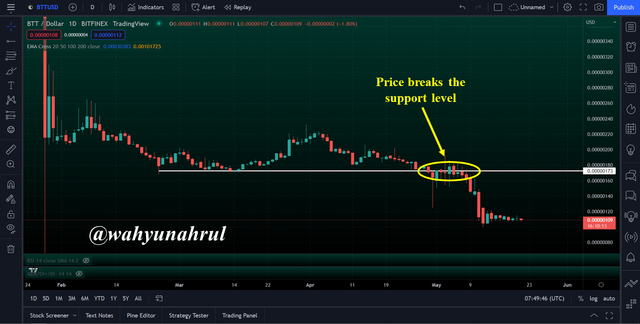
But the BTT price movement has passed the support level at $0.00000173.
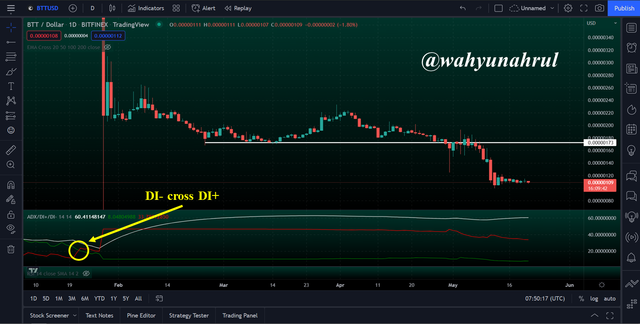
The Death Cross is also shown by the ADX indicator by the presence of a cross between the DI+ and DI- lines. This crossover has actually been going on since a few weeks ago.
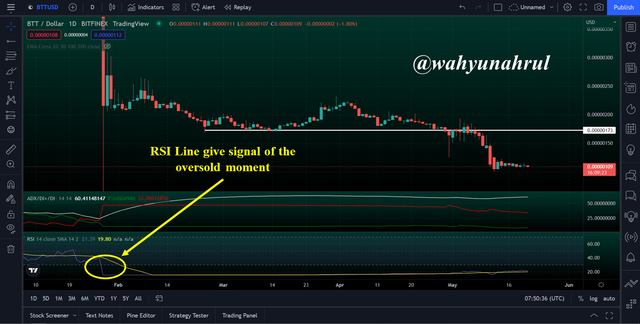
And finally, we are also given an oversold phase signal from the RSI indicator where the RSI line has moved below the lower band.

Disclaimer:
Your post was upvoted and resteemed on @crypto.defrag
Downvoting a post can decrease pending rewards and make it less visible. Common reasons:
Submit
This post was upvoted by @hustleaccepted
To get endless upvotes use the tag #hustleaccepted and follow our account
You can also post at our community Hustle Accepted
Wish you the best luck ❤️
Downvoting a post can decrease pending rewards and make it less visible. Common reasons:
Submit