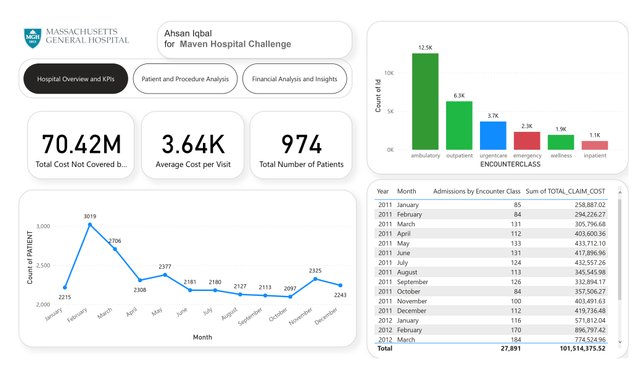
Assalam o Alakium, Everyone. I hope all of you are fine and happy in your lives. Today, I am sharing my latest challenge, which was organized by Maven Analytics. In this entry, I made a Power BI dashboard using a dataset provided by Maven Analytics. The database was basically a hospital dataset. As you can see in the dashboard, the hospital's name is Massachusetts General Hospital.

I have used many charts to elaborate and show the best insight for better results. On the first page, I used some KPIs. By the way, KPIs are the most important for any dashboard. I also used a line chart for trending and forecasting. The right upper chart, a column chart, shows which department of this hospital has more entries.
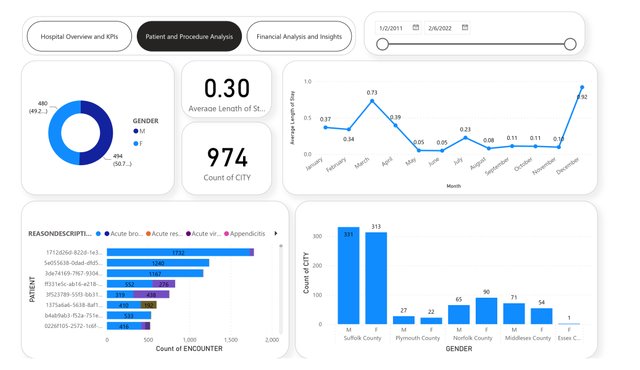
- Patient and Procedure Analysis:
I use a donut chart for the partition of genders. Ratio of Male and Female. You can see on the right side I use a line chart. This shows how much time any patient stays in hospital. This is an average by month.

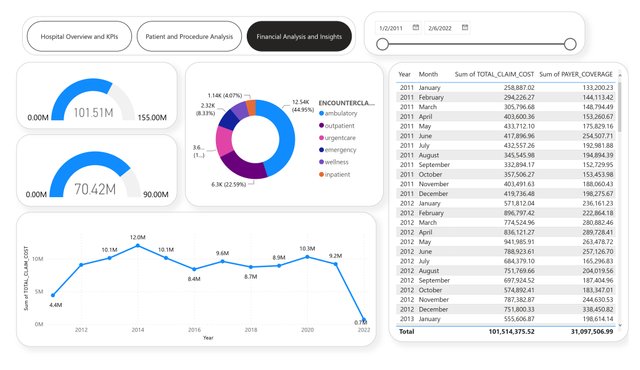
- Financial Analysis and Insights:
This page has more details page for this dashboard. These are important charts in every DashBoard. They help to specify things in little time. They have a beautiful representation. All the charts are responsive to each other. When you click one chart you will see strands will be changed along the product or city. Thank you for reading my blog.