Made with Canva
Welcome to Forex Insights, Your Gateway to Smarter Trading! Today we will be analyzing the EURUSD currency pair for the week of 22-26 July 2024

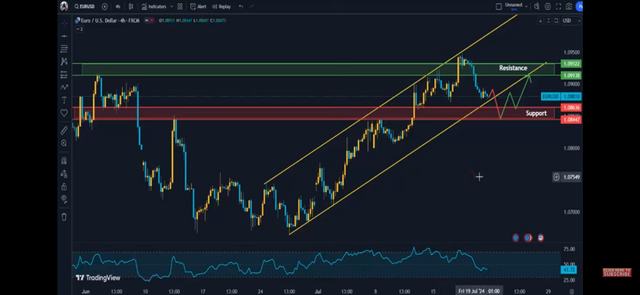
At the 4-hour timeframe, the pair has been trading within an ascending channel, marked by yellow trend lines. The major resistance is around the 1.09372 level. The intermediate resistance is around the 1.09138 level. The Major support is around the 1.08447 level. The intermediate support is around the 1.08636 level. The price recently tested the resistance area and seemed to be pulling back toward the support zone.
The RSI is around 41.72, indicating that the market is not overbought or oversold, providing room for further movement either way. If the price can hold above the support zone (1.08636 - 1.08447), it might test the upper resistance levels again, potentially breaking out of the ascending channel leading to a bullish scenario. But, if the price breaks below the support zone, it might signal a reversal or a deeper correction, targeting lower levels around 1.0800 or even lower leading to a bearish scenario.
The 4-hour chart shows a potential bullish bias within the ascending channel, but key support levels need to hold for further upside.

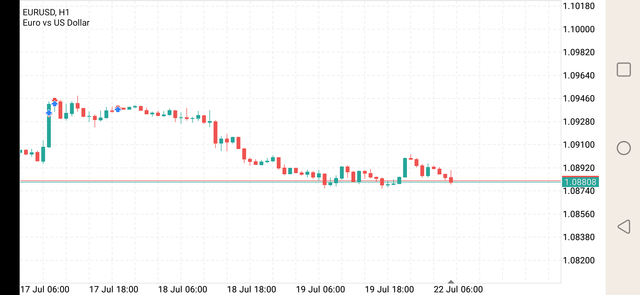
In the 1-hour timeframe, The price has been in a downtrend since July 17, consistently making lower highs and lower lows.
Currently, The pair is trading around 1.08808. The recent candlestick patterns indicate consolidation around the current level, suggesting a potential pause in the downtrend. If the price can form a base around the current level and break above the recent highs around 1.08920, it might signal the beginning of a reversal towards higher levels leading to a bullish scenario. But, If the price continues to face resistance and drops below the recent low of around 1.08740, the downtrend might continue, targeting lower support levels leading to a bearish scenario.
The 1-hour chart indicates a recent downtrend with potential consolidation, suggesting caution before taking any long positions. A break above or below the immediate levels will provide clearer direction.
Nice Analysis I'll take note of those points
Downvoting a post can decrease pending rewards and make it less visible. Common reasons:
Submit