 Captured with my Galaxy-A15 and edited with PhotoStudio
Scale in Engineering Drawing

Scale In technical drawing, refers to the proportional relationship between an object's actual size and its depicted size on paper or digital medium, while ensuring accurate proportion, measurement and visualization.
Assuming you are to draw the following items, on a piece of plain paper of size A3 or A4.
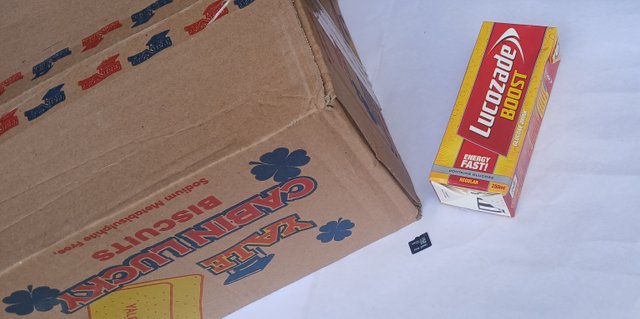
A carton of biscuits.
A pack of lucozede boost energy drink.
A 32 Gb SD card.
You will agree that a drawing is usually a representation of an actual item, and in most cases, it is not drawn using the exact dimention as the real object. They are most of the time smaller, such that it can fit well on the paper.
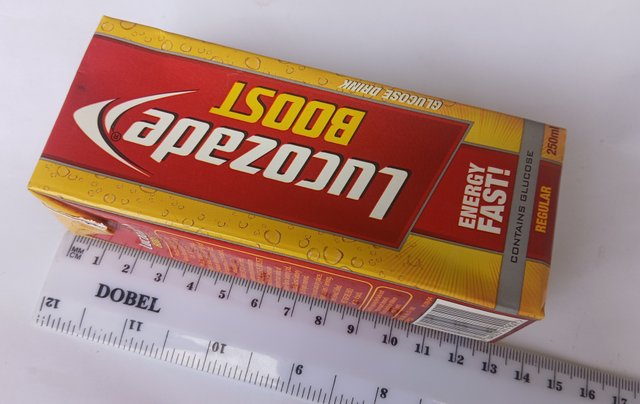
A pack of lucozede boost drink is 130 x 54 x 36 mm. So drawing it with its actual dimensions will not really be a problem for our A3 or A4 paper size. Using the appropriate terminology, we would say that drawing this energy drink pack at full-size will not be a problem.
Unfortunately, the same can not be said of the carton of biscuits. It is just too large to draw at full-size on an A3 or A4 paper. You will have to draw it smaller than its actual size, so it fits on the paper. The carton of biscuits should be drawn at a Reduced scale.
On the other hand, drawing the SD card, which is 15 x 10 x 1mm in full-size, will result in a drawing that is practically too small to show any useful details. For the purpose of clearity, it would be best to draw it much larger compered to its actual size at an Enlarged scale
When drawing, some things are too large, and will have to be drawn at a reduced scale while others are too small and the scale will have to be enlarged.
| Representative Fraction(FR) |
|---|
Representative fraction is a method of expressing scale using a fraction where the numerator is the distance on the drawing and the denominator corresponds with the distance in real life.

Assuming a distance of 5m on the ground was represented as 5cm on paper.
Let's start by making sure all values have the same unit by converting the 5m to cm.
1 meter = 100 cm
So 5 meter = 5 x 100
= 500 cm
Using the formula for Representative Fraction:
Distance in drawing = 5cm
Distance on ground = 500cm

For this example, the FR is 1/100 meaning the drawing has been reduced 100 times.
While RF is represented as a fraction, the scale of the drawing is presented as a ratio.
In this case, the scale is 1:100
| Lets consider a practical example |
|---|
Using my ruler, as I mesured the height of the lucozede boost pack, i realised a total of 130mm as length. I now use my calculator to divide 130mm by 2, which gives me 65mm.
On my drawing paper, I draw my lucozede pack with a length of 65mm.
Now, because I divided its lenght by 2,
I also have to measure its width and then divide it by 2. This will be 54 ÷ 2 = 27mm
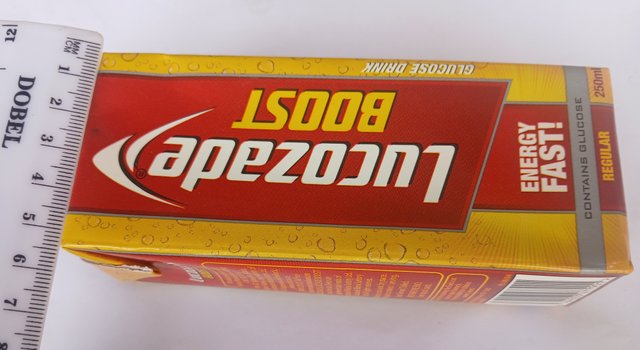
For the third dimension, I measured Its height and got 37 mm and and when I divided it by two, it gave me 18.5mm
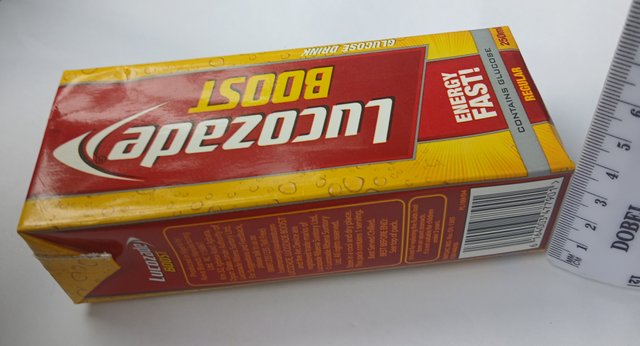
Drawing the lucozede boost pack with dimensions 56mm x 27mm x 18.5mm will mean downscaling the actual size by a half.
If we are to use the FR formula, picking the width for our example.
The actual width in real life is 54mm
The width on paper is 27 mm
FR = width in drawing is divided by width in real life
FR= 27/54 = 1/2
You can equally try this out, using the lenght or height of the lucozede pack as shown above.
Now I have to provide information that says: this diagram is not full-size, it has been scale down such that every mm on the paper is 2 times larger in real life.
The scale used here is 1:2
Can you identify the scale in the picture below?
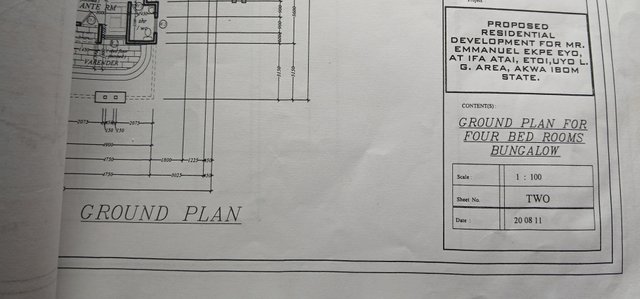
To apply this knowledge, we will have to draw the lucozede boost pack using a presentation style known as an orthographic projection.
It is a drawing that shows you the front view of some relevant sides on an object. It presents the front view, top view and side view.
Divide the paper into four segments
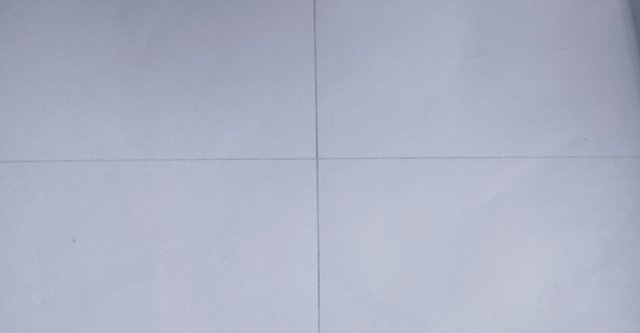
And here is how the placement is going to be. Note how the top looks, each time you flip it over. Start by placing the object at the bottom left quoter.
Flip it upwards once into the top left quoter.
Finally, you will flip it over to the right once
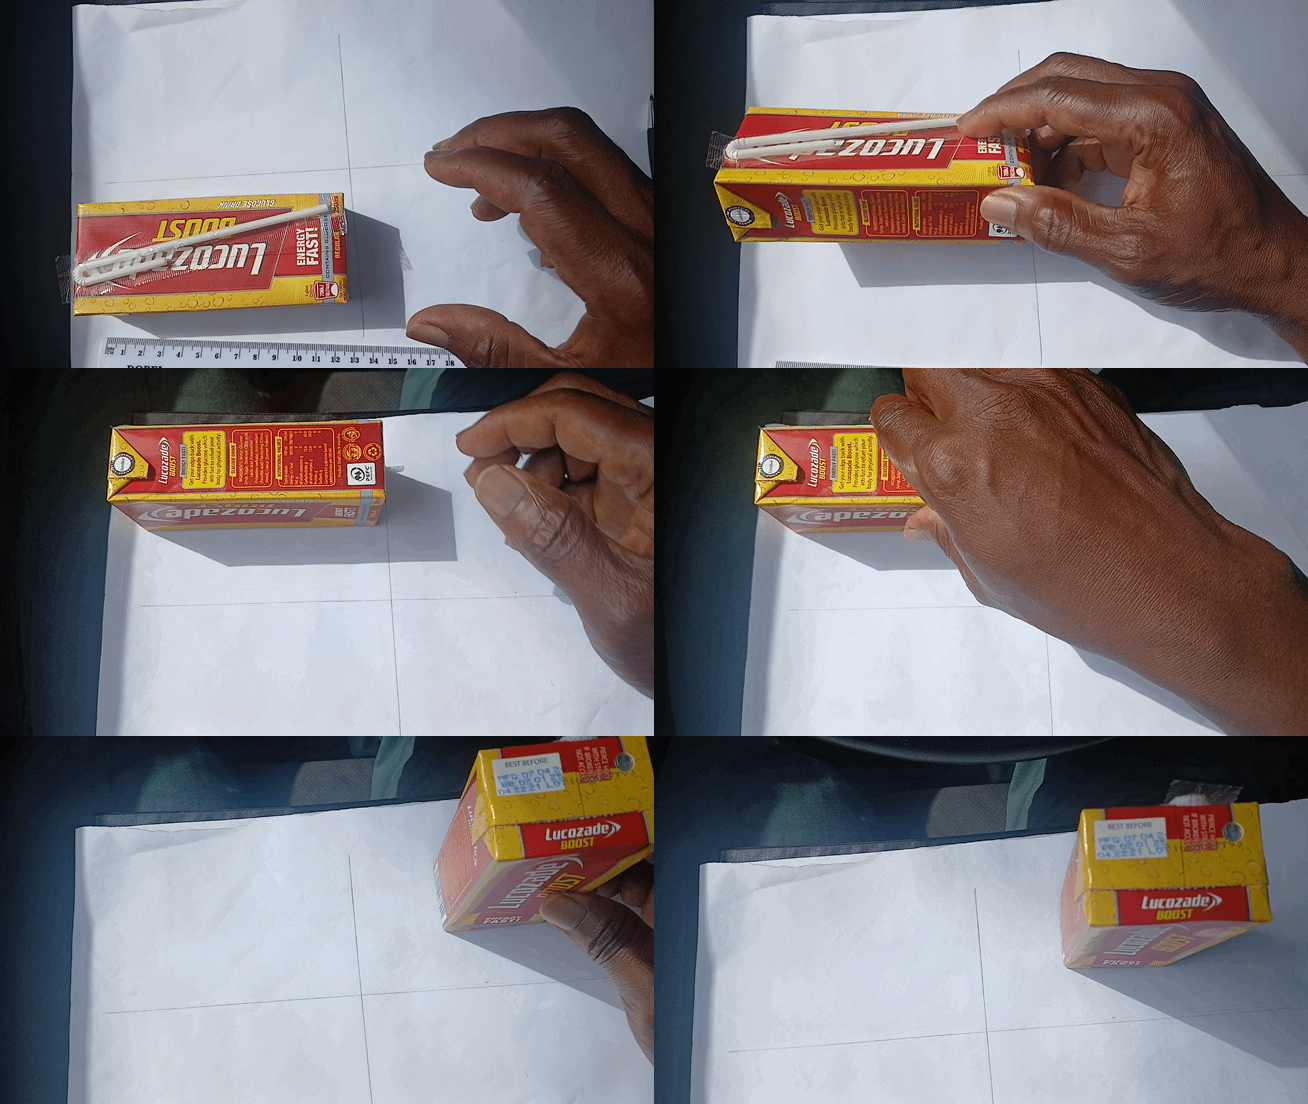
During this process, the sides facing up will be as shown in the rough sketch below.
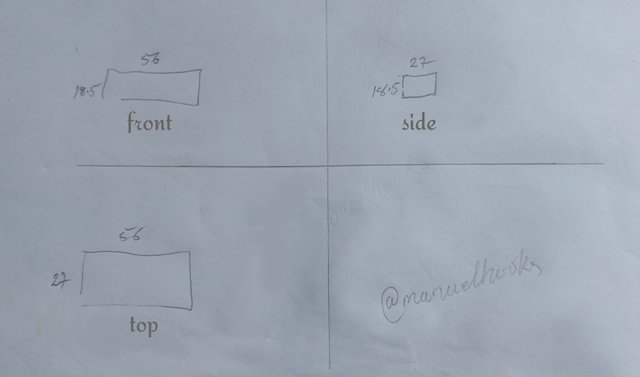
| First Angle Orthographic Projection |
|---|
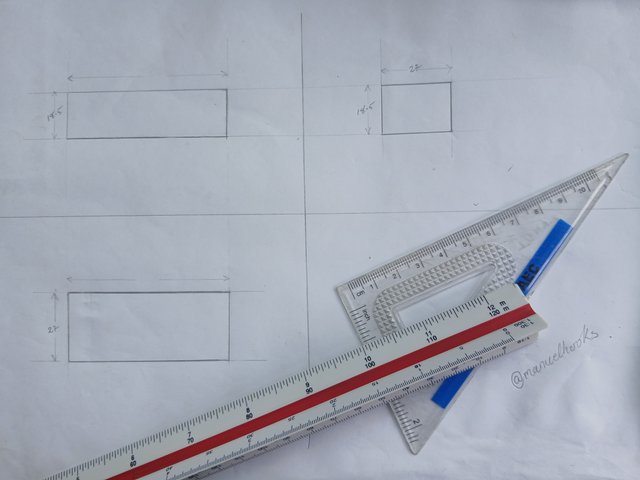
This is the lucozede boost pack presented from multiple viewpoints using a first angle orthographic projection method at a scale of 1:2.
| Using a scale ruler makes it simpler |
|---|
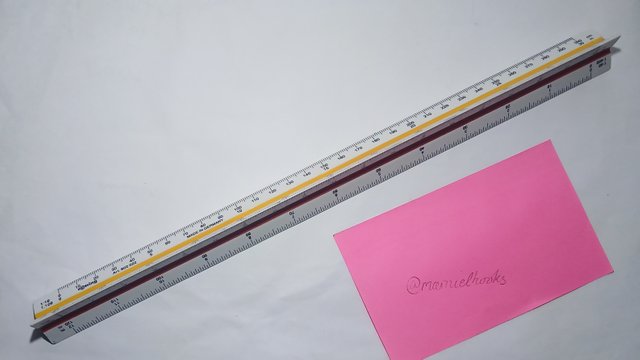
Learn how to draw to scale with a scale ruler
Drawing to scale is easy and faster with a scale ruler. Learn more about scale rules by following this link.
| What scale is best for my Drawing? |
|---|
To determine what scale would be best for your drawing, you would have to take into consideration a number of factors that interplay.
- Scale factor
- Paper size
- Detail level
- Readability
- Margin requirements and annotation
When drawing, always make readability your priority. A larger scale would enhance readability and details but your paper size may not agree with you on that, so it has to be taken into consideration and at the end of it all, you will need space for labelling and dimensioning.
Use the scale that allows your drawing to fit well on the paper, providing enough details and is readable.
You will be more effective if you also take into consideration the purpose of the drawing, the object's size and its level of complexity with the desired level of precision.
Take up the drawing project. Divide the actual size by the scale factor. If the resulting drawing size is larger than the available drawing space, go for larger paper or adjust the scale factor down.
| Conclusion |
|---|
We have explored the concept of scale in technical drawing, from scales that are larger than real life to scales that are equal to real life and some that are smaller than the real-life sample.
The scale of a drawing can be represented as a fraction or as a ratio. Understanding scale is critical for accurate representation in technical drawing.
In our next lesson, we shall be creating a scaled orthographic projection of our lucozede boost pack
If you would love to start reading from the introduction to technical and engineering drawing, we have this link for you.
| Lesson 1 | Introduction |
| Lesson 2 | Lines |
| Lesson 3 | Scales and scale ruler |
| Up Next | Orthographic Projection |
All pictures are my pictures, captured with Galaxy-A15 and edited with PhotoStudio App.
#engdrawing #drawing #burnsteem25 #learnwithsteem #steemexclusive
#nigeria #club5050
https://x.com/manuelhook41759/status/1848044853835227613
Downvoting a post can decrease pending rewards and make it less visible. Common reasons:
Submit
Upvoted. Thank You for sending some of your rewards to @null. It will make Steem stronger.
Downvoting a post can decrease pending rewards and make it less visible. Common reasons:
Submit
Downvoting a post can decrease pending rewards and make it less visible. Common reasons:
Submit