Hello my fellow crypto enthusiasts! How did you liked the previous day on crypto market? Were you worried BTC breaks support line, goes beyond 30k, and stays there? I wasn’t and here is why.

Source
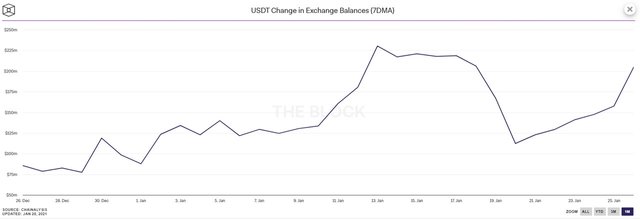
It is always important to look at multiple indicators. Some of them may not be directly bound to the charts. One of the first things I usually look at is what is happening with exchanges balances. Many services share this information. What do we want to see? If you are in crypto for at least a few months, I bet you heard the theory Bitcoin moves are pumped with stable coins emission. Usually “investigators” point on Bitfinex and Tether and highlight some strange transactions. I’m not sure if any of this is true, but inflow of stable coins to exchanges usually means prices are going to rise.

Source
As you see on the chart above, USDT trend changed on Jan, 20th. Since that day, millions of USDT were sent to exchanges. Situation with other stable coins is the same. We want this trend to continue for Bitcoin to reclaim all lost positions. Yet so far, I can't say we have enough stable coins on exchanges to break through to 40k again. But what is happening with BTC and ETH balances?

Source
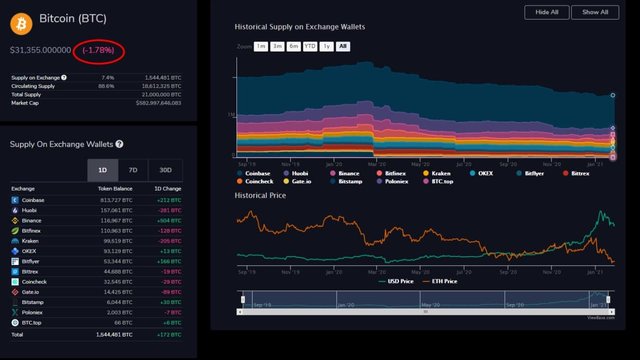
We can see that yesterday (Jan 28) BTC was slowly moving out of exchanges. The same was happening to ETH. These two facts combined shows that stable coins are moved to exchanges to buy coins at a good price. Then coins are moved out to cold wallets. So far these are just small moves. If we see more BTC and ETH leaving exchange balances, it can support the bull run.
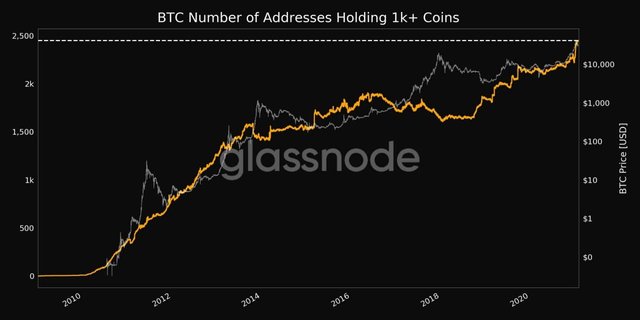
The second thing you want to add to the picture is what whales are doing.

Source
What a surprise! The number of Bitcoin wallets with more than 1k BTC reached a new all-time high yesterday. Apparently, whales vote for BTC pump with their money.
We haven’t looked at Bitcoin chart yet, but we already start to see a bullish trend. This is why you need to pay attention to major tendencies. This doesn’t mean you don’t need to study charts though. However to do technical analysis, you need to have some skills. To see the trend I showed here, you just need to know how supply/demand chart looks like. Stable coins bring up demand for BTC and Alts, BTC and Alts moving out of exchanges reduces supply. These moves support the prices.
The downside of it, is that sometimes you can't verify the data. Exchanges may have other wallet they don't register. From time to time they move coin between wallets. Public services tracking these moves (like the ones I used to show you the charts) can't always show the true picture. Yet an overall trend is usually visible.
Disclaimer
I’m not a financial of any kind. I encourage you to check all information yourself and make decision only based on your own opinion. All articles are created for solely entertainment purpose.
If you like this post please vote for it and follow my blog. Feel free share your thoughts in comment section.
Your post has been curated by us! Received 20.00% upvote from @opb. Do consider delegate to us to help support our project.
Do join our discord channel to give us feedback, https://discord.gg/bwb2ENt
* This bot is upvoting based on the criteria : 1. Not plagiarised, 2. Post > 5min, 3. Author reputation > 25 4. Active engagement with othersDo upvote this commment if you 💚 our service :)
Downvoting a post can decrease pending rewards and make it less visible. Common reasons:
Submit