Hey, friends hope you are well and welcome the new update on Zcash (ZEC) coin. In this video you will watch how:
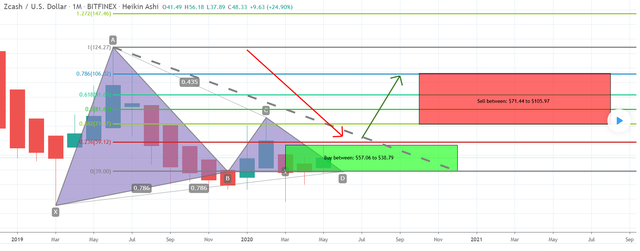
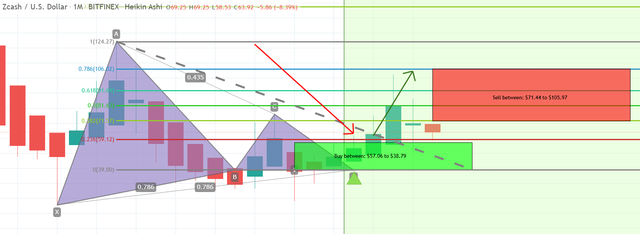
My previous idea has been successfully executed as below:
The previous idea before execution:

The previous idea after execution:

Click here to visit this old article on tradingview
Click here to create an account on Binance, the best place to buy or sell Zcash coin
Now on the weekly chart, the priceline is having a very nice bounce from 25 and 100 simple moving averages moreover the 25 SMA also has formed a bull cross with 100 simple moving average. The 200 SMA is at $135 that can work as strong resistance as well.
On the daily chart, the priceline is moving in down-channel since 1st Aug 2020. Now finally the priceline is closed above exponential moving averages with the time period of 10 and 21. The EMA 10 and 21 also have formed a bull cross that can lead the priceline of Zcash to breakout the resistance of this down channel as well.
Volume profile of complete channel showing no interest of traders below $51 and very less interest above $80. Therefore a movement upto $80 is confirmed and there will be less chances to break down the support.
As we have seen earlier that the priceline of ZEC is getting bounced from the 25 and 100 SMAs on the weekly chart and also closed above the EMAs 10 and 21 on the daily chart and likely to break out the resistance of the down channel as well. In the meanwhile, it has also formed the most significant bullish move and that move is the price action has reached the support. And this is the strongest support since Nov 2019. We can observe that after reaching this support the priceline 1st rallied 186% then 209%. At this time we can again expect another powerful bullish move again.
Click here to create free account on tradingview to watch and play the chart on realtime
Conclusion:
Even though the priceline is having a very nice bounce from the long term support on the weekly chart, however, we should use this support as stop-loss as well. If the next bullish rally will be started from here (as it seems to be) then a move up to 200 SMA can be expected that is at $135 at the time of writing.