Steem/usd price is now breathing at around 17 cent. I think it has completed correction from recent high 38 cent at 19th march. So many critics said steem price will dump next few month due to heave power down. I do not think so. Because steem currently trading on so many reputed exchanges like binance,upbit,bithumb and bitrex. When justin sun bought steemit then suddenly price pumped and touched to 38 cent. Cause that news was a light of hope from all investor.
Today i am sharing my analysis about steem price. Fundamentally steem has great basement now and a reputed coin will never fail when crypto market is rising. But recent fall of crypto market due to a deadly disease corona virus. Corona is now rulling the whole world. So, this fall is temporary.
Steem/usd Info
Steem rank 71th now based on total market capital(source:coingecko)
total supply 367 million
circulating supply 324 million
current daily trading volume of today 3.6 million usd.
Steem All time high was 8.19$ in january 2018
Steem All time low was 0.07 in mar 2017
Total Market capital 59.54 million usd.
Today price 17.17 cent.
Technical Analysis

Technical analysis is most trusted analysis of trades. Although i prefer fundamental because i am a daily trader. But for long term trade technical analysis is best.
Daily Chart Of steem/usd
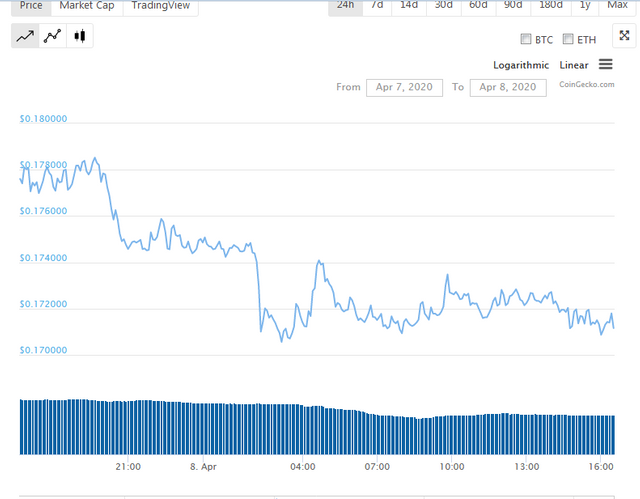
Daily High 17.82 cent
Daily low 17.08 cent
The day started with 17.82 cent and now coiling toward slight down. Some downwards pressure still going on. Bears ar controlling market now. It will be better to find buy point around 16.50 to 16.90. Sell position is not a wisely decision.
Market capital in Daily chart
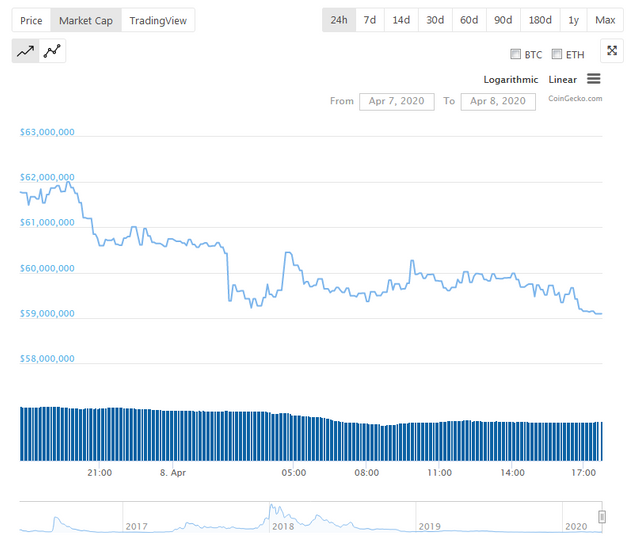
Today high 62 million
Today low 59.26 million
Here we can see a tight daily range is going on. May be seller are not confident for hold position long time. In lock down time maximum trader focus on daily profit and loss.
Moving average and Oscillator in Daily chart
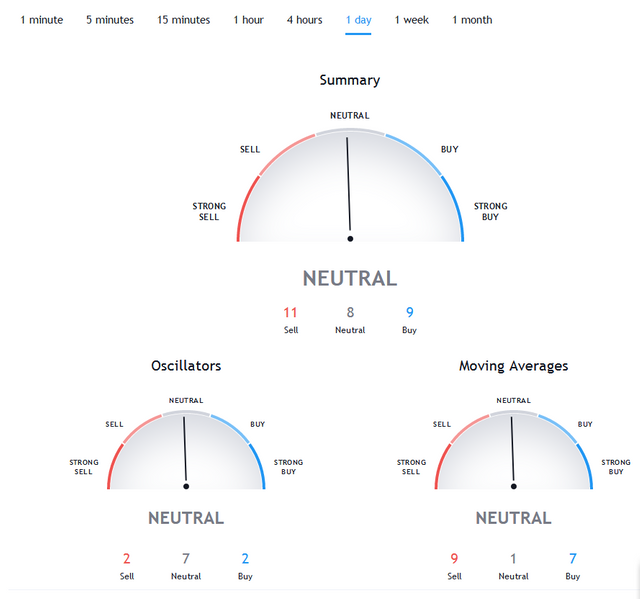
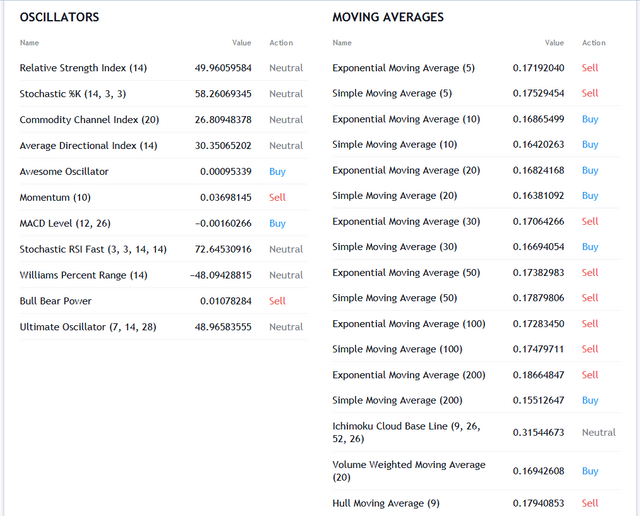
Over all summary is neutral. Most of the movies average indicator showing sell signal and some are buy.9 sell and 7 buy. Now i have to check it long term moving average. 10,20,30 days average showing buy and 50,100,200 days indicating sell. We know suddenly steem got bounce 3 days ago. So, still short time frame is positive for buyer.
In oscilator 7 out of 11 indicator showing neutral. It is confirming us about tight side ways move.
Weekly Chart steem/usd
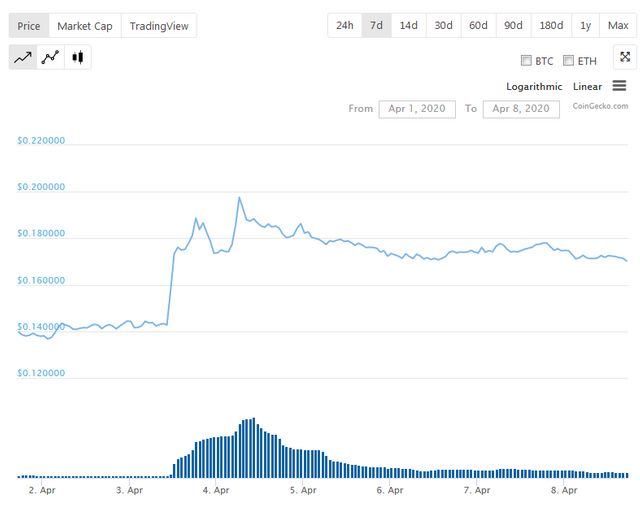
weekly high 19.75 at 4th April
weekly low 13.26 at 2nd April
week started when steem price was around 13 cent. Buyer caught the market from low level. A pump happened and price touched above 19 cent. After that price now mute or going under side ways move.
Market capital in weekly chart
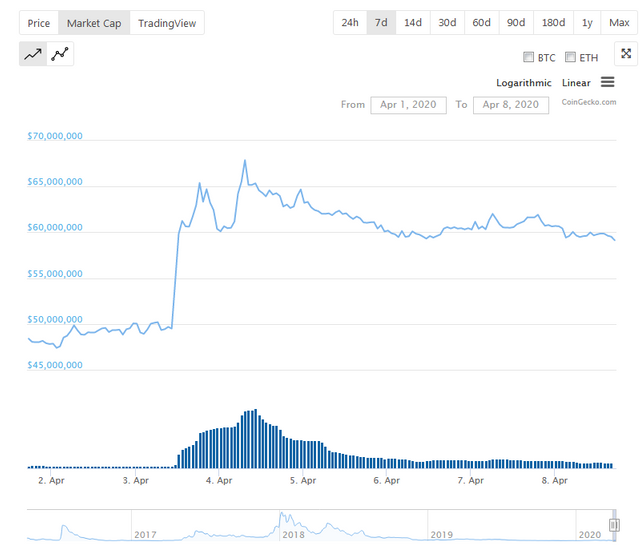
Weekly high 67.87 million at 4th april
weekly low 47.85 million at 2nd april
A good reputed steem coin price is not in fair price now. I think fair price is above 20 cent. But due to heavy power down it is now struggling. Market capital has good number now. And investor are happy to open buy from higher low position.
Moving Average and oscillator in weekly chart
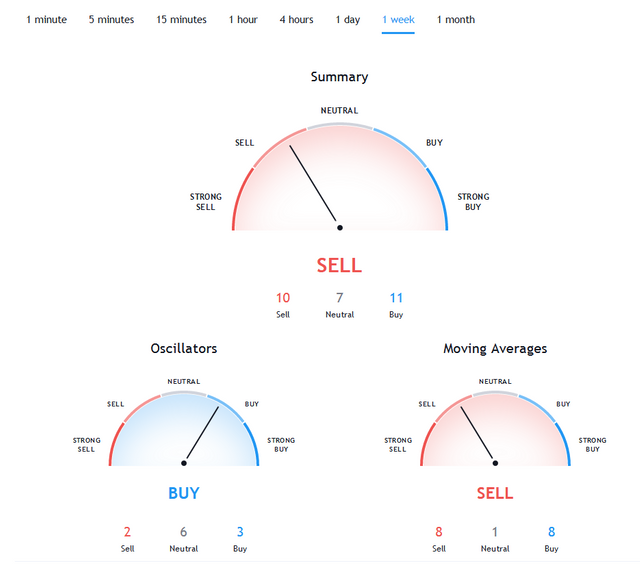
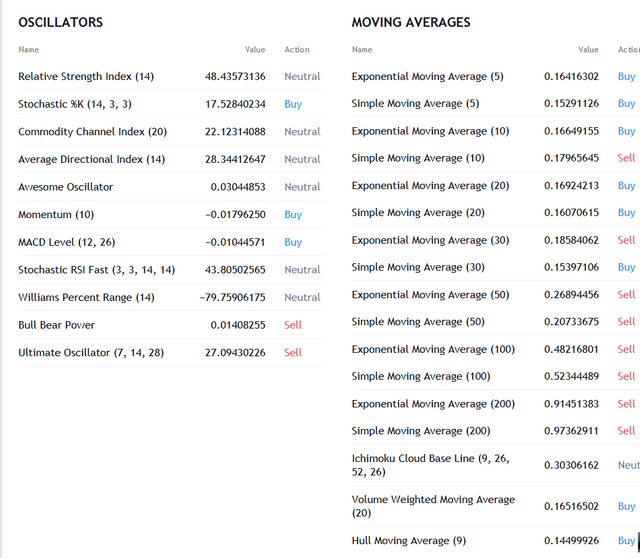
Overall summary showing sell but most of the indicator are indicating buy. 5,10,30 days moving average showing buy due to recent bounce. But 30,50,100,200 days indicating sell. Because we have surpassed a huge downtrend. It need still time to develop positive market on chart.
Steem/usd Monthly chart
My prediction before seeing chart that it must show sell position.Because monthly chart is not become positively updated.
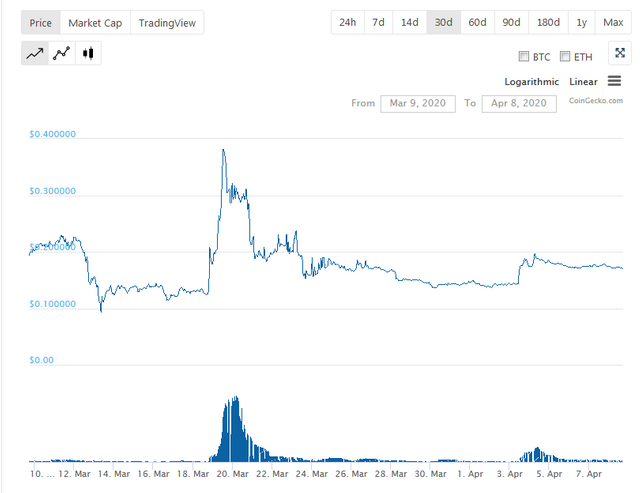
Monthly high 38.14 at 19th march
Monthly low 11.13 at 13th march
Here you can noticed huge difference between monthly high and low. From low level market got bounced cause of justin sun suddenly appearance. That time investor was very happy and pumped happen.If we hold 11 cent a bottom and 28 cent high then market price rejected from 38 cent and moved towards near bottom again. But bottom line is still alive.
Market capital in Monthly chart
s18.png
s19.png
Monthly high 128.70 million at 19th march
Monthly low 36.84 million at 13th march
There is huge difference between high and low. That time bull had taken controlling of market and broke so many resistant and now it again came down and may be it complete the correction move.
Moving Average and oscillator on Monthly chart
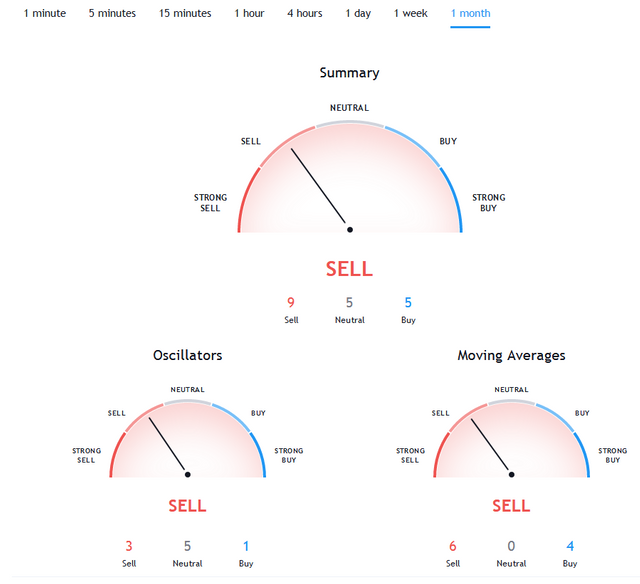
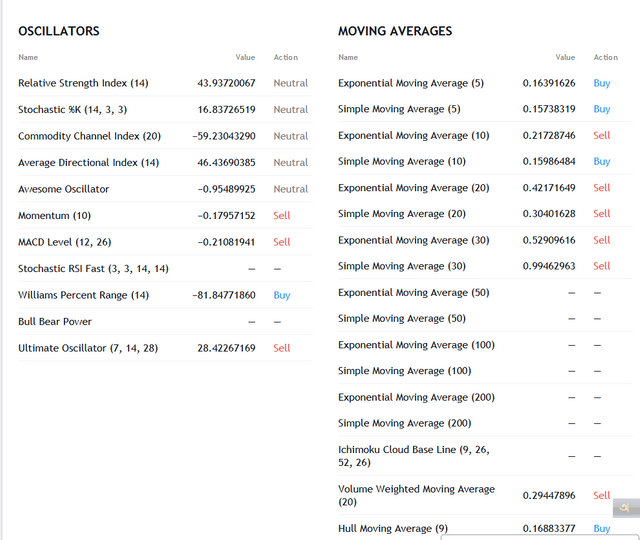
My guess become true. Most of the indicators showing sell signal. And longer term moving average are still now showing sell.RSI stand now 49. It is a neutral area. Stochastic Commodity Channel Index both showing neutral.
Fundamental Analysis

Fundamental analysis is my favourite analysis. But now we do not have any fundamental news. We know oil and gold price are now suffering due to corona virus news. Forex market has huge volatility. Corona damaged Stock market index of world.
My trading Advise
First advice stay sidelines. second advice do not open sell. Third advice open buy from higher low position. We can see a new bounce in upcoming week. Steem is now good reputed coin and become strong position than before.
All screenshot taken from
https://www.tradingview.com/symbols/STEEMUSD/technicals/
https://www.coingecko.com/en/coins/steem