 Canvas Editing Canvas Editing |
|---|
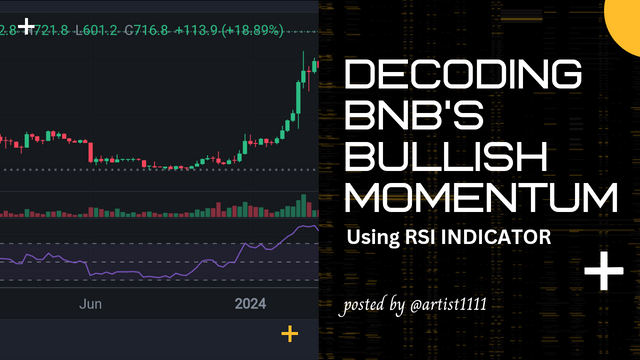
An indicator of momentum that gauges the rate and direction of price changes is the Relative Strength Index (RSI). The purpose of the process is to determine if a market is overbought or oversold.
An overbought stock is often indicated through the RSI above 70, while along with oversold stock is indicated by an RSI below 30.
Let's delve into the technical analysis of the RSI for BNB/USDT as illustrated in the following charts on different time frames .
 TradingView TradingView |
|---|
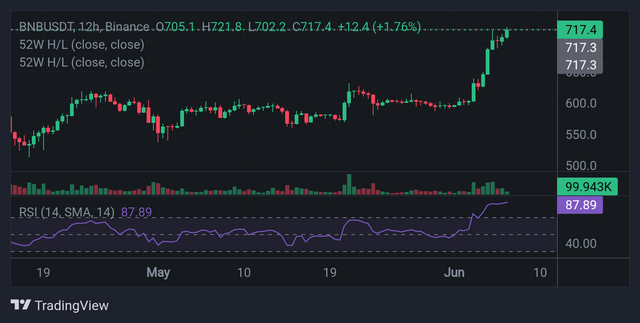
12-Hour Chart Analysis
First of all i open 12-hour chart, BNB/USDT is exhibiting strong bullish momentum. With an RSI of 87.89, it is currently far higher than the overbought no doubt threshold of 70. This high RSI makes it quite evident that there is strong buying pressure on BNB. Even if bnb/USDT is overbought, the market action exhibits a steady rising trajectory, indicating to a strong bullish trend. Because such high RSI levels typically precede price declines or consolidations, traders should exercise caution.
 TradingView TradingView |
|---|
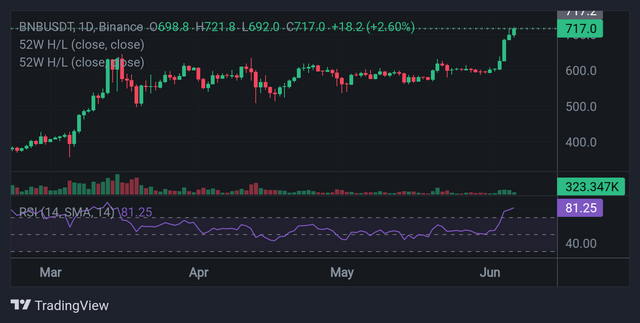
Daily Chart Analysis
The daily chart shows a similar bullish trend because i open it for today, with the RSI at 81.25. Again, this is well above the 70-mark, reinforcing the overbought status.
It is evident from the chart that there's has been consistent purchasing interest in the pair as the daily RSI has been slowly rising. A positive indication could be indicated by the price breaking past previous resistance levels.
A pullback or an instance of sideways movement to process the recent gains might be the reason indicated by the increase in RSI, however I can't says hundered after its crypto trading, you know....😊.
 TradingView TradingView |
|---|
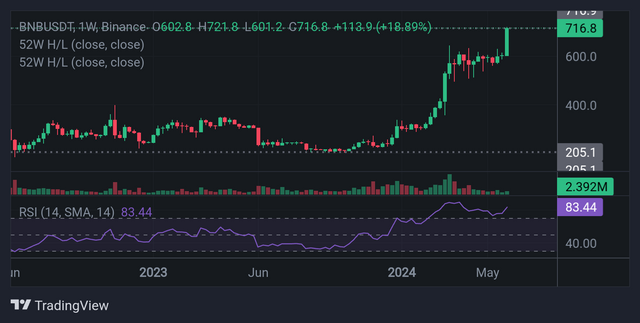
Weekly Chart Analysis
The weekly chart, which has an RSI of 83.44, offers a more comprehensive view. The weekly timeframe's high RSI shows a robust long-term bullish trend. On the weekly chart, overbought conditions imply that BNB has been in an extended rally. According to previous information, these high RSI levels frequently result in corrective phases, during whereby the price retraces or consolidates before continuing its upward trend.
Current Price Action Analysis
BNB/USDT is currently trading around the 717 level across different timeframes. The price action shows a significant breakout, supported by high trading volumes, particularly on the weekly chart with 2.392M in volume. The breakout past the 700 resistance level with strong volume confirms the bullish sentiment.
Strong bullish momentum is indicated by an oversold state on the 12-hour, daily, and weekly charts of BNB/USDT, according to the RSI analysis. Even if there is strong buying demand, traders ought to remain on the lookout for any possible pullbacks or consolidations because of the overextended RSI levels. In this case, risks can be managed with the aid of strategic planning techniques includes placing stop-loss orders or thinking about taking partial profits.
The positive trend appears to be continuing based on the price as well as volume activity at the moment, although caution is needed to handle any corrections.
Kind Regards
@artist1111

Adieu, folks!
May the winds of fortune
carry you to greatness!
May the winds of fortune
carry you to greatness!
X-promo : https://twitter.com/HamadkhanMWT/status/1798734662724120763?t=qyBhf2kMmfhcGyGhXnEA1w&s=19
Downvoting a post can decrease pending rewards and make it less visible. Common reasons:
Submit
Note:- ✅
Regards,
@theentertainer
Downvoting a post can decrease pending rewards and make it less visible. Common reasons:
Submit