 Canvas Edit Canvas Edit |
|---|
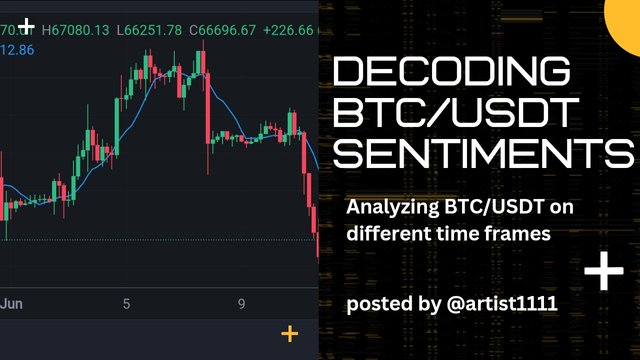
Greetings to everyone. This is me @artist1111 once again . Today, I am once again going to analyze the market sentiments by examining the price action of Bitcoin (BTC) across different time frames charts.
I am pretty sure that this analysis will provide pretty good highlight the current BTC/USDT market sentiment on 13/06/2024 and potential future movements.
Let's dont wait, jump in by first looking at the weekly time frame, then the daily, and finally the 4-hour chart.
 Weekly time frame Weekly time frame |
|---|
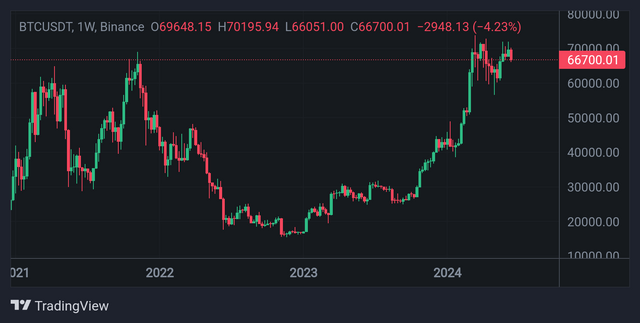
First of all, I open the weekly time frame. The weekly chart shows that Bitcoin is currently trading at $66,700.01 and nearer .
Over the past several weeks history, the price has faced significant resistance around the $70,000 level. After hitting a high of $70,195.94 recently, the price once again has pulled back.
The chart on weekly time frame indicates a potential double top formation, which could signal a bearish sentiment if the price continues to decline. However, the overall trend from 2022 to 2024 has been upward very positive sign, showing strong bullish momentum over the longer term.
 Daily time frame Daily time frame |
|---|
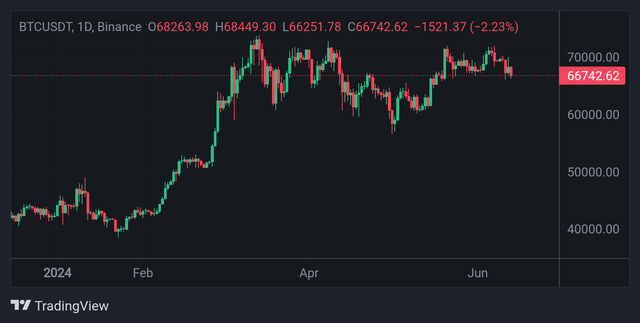
Next then, I open the daily time frame chart in tradingView. On the daily chart, Bitcoin is priced at $66,742.62. The recent high was $68,449.30, but look into it the price has since retraced. The daily candles clearly show a series of lower highs and lower lows, suggesting a short-term bearish trend.
The current price action highly appear to be consolidating just below the $67,000 mark, personal i do think indecision among traders. If the price breaks below the recent low of $66,251.78, it could lead to further declines which is 62000$ next level .
Another hand, a break above $68,449.30 would solidl indicate a resumption of the bullish trend.
Its all i found in daily time frame .
 4-hour time frame 4-hour time frame |
|---|
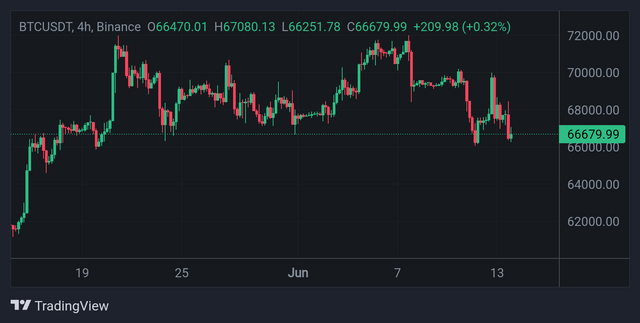
Finally, I closely examine the 4-hour time frame. The 4-hour chart shows Bitcoin at same level 66679 . There is a noticeable short-term support level around $66,251.78 and i believe it will not break, with the price having recently bounced off this level.
The 9-period moving average, currently at $67,712.86, is slightly above the price in the chart, suggesting that short-term momentum is bearish. However, the slight upward movement in the latest candle will positive sign and will shows some bullish recovery attempts.
If the price can break above the moving average & sustain that level, it might indicate a shift towards a bullish sentiment in the short term.
In summary to the today market analysis, the as a whole weekly chart suggests a potential bearish reversal, but no doubt the longer-term trend remains bullish. The daily chart indicates short-term bearishness since last night, with key levels to watch for potential breakouts.
The 4-hour chart also shows short-term bearish momentum with some signs of a possible bullish recovery. Overall, traders should watch key support & resistance levels closely to gauge the market's next move.
Kind Regards
@artist1111

Adieu, folks!
May the winds of fortune
carry you to greatness!
May the winds of fortune
carry you to greatness!
X-promo :https://twitter.com/HamadkhanMWT/status/1801324403558649882?t=RVmb5maTruyWiRu3HUspTA&s=19
Downvoting a post can decrease pending rewards and make it less visible. Common reasons:
Submit
Have you taken any trade on the base of your price history that you shared with us?
Is your post meet our all community rules.
https://steemit.com/hive-150122/@bountyking5/basic-rules-and-guidlines-for-crypto-market-prediction-posts-or-steem-alliance-community
Downvoting a post can decrease pending rewards and make it less visible. Common reasons:
Submit
This is an AI Base Contest. 72% AI-generated.
@bountyking5
@jueco
Downvoting a post can decrease pending rewards and make it less visible. Common reasons:
Submit
Always share the ss.
Downvoting a post can decrease pending rewards and make it less visible. Common reasons:
Submit