The Wyckoff Method |
|---|
The Wyckoff Method is a tool that is used under technical analysis by traders develop by Richard Damile Wyckoff known for his in-depth knowledge, understanding and analysis on the stock market. This method presents the idea that prices can be anticipated through analysing data related to volumes, action in price and time and price prediction which will lead to the understanding of demand and supply of a particular asset.
He concluded that the best time to place orders that are long is when the price is about to be marked up and we're about to reach the end of the accumulation area. For short orders, when we noticed that supply of an asset is becoming greater than the demand we can set it at that. This method tends to improve market timing when an order is placed or before one thinks about entering into a certain asset. ..
This Wyckoff Method is based on three fundamental laws that makes it unique. These laws are;
the direction of an asset is determined by supply and demand. The higher the demand volume, the higher the price. The lower the price, the higher the supply. Applying these by checking prices and volume will allow us have a different view or insight on the market cycle.
Cause and Effect Law state that nothing in the general market happens for no reason and comes with a consequences of a specific events that creates preparation period.
Accumulation: which is the cause-initiates a markup/rise in the price which is the effect.
Distribution which is the cause - leads to a markdown/fall in the price which is the effect.
Laws of Effort Vs Result |
|---|
Effort od all about the volume that the asset has
If there is a connection between the volume and the price action, then we can be sure that the is likely to go to its course. If we get to see that this connection does not exist or there are significant changes regarding volume and price, then, that's a clear sign that the trend might suffer a charge. Remember this, so as to identify it easily:
High Volume = Big Effort
Low Volume= sideways movement in the chart - small effort
Composite Man |
|---|
One of the main things that this method has is that it recognised the idea of a composite man. What's a composite Man. The composite man is just an imaginary representation of the market that supposed to help us understand in simple way how the different movements are impacting the fluctuation of prices. Due to this, what are thinking of the market as if it was controlled by one single identity instead of a group of investors. From the analysis that Wyckoff did, we came to know that;
we can predict prices and movement of assets if you understand the behaviour of composite man.
we can analyse the market and charts as well as getting the rest of the investors to buy the assets he has been accumulating at a lower price.
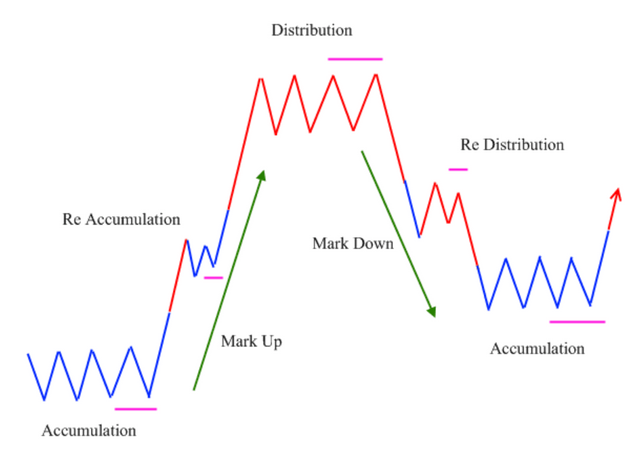
Phases: there are four phases that composite man performs which includes;
Accumulation: composite man accumulate assets before investors get in as there's not much variation in price and volume is the chart goes sideways
Markup/uptrend: Once the accumulation is over and supply of assets get scared, the composite man who makes the price go up which will attract investors. In the chart, we will clearly see that demand gets a lot higher than supply. It can also happen that during a mock-up. There is some other reaccumulation phase.
Distribution: The chart will go sideways again and the composite market will start selling his position slowly until the demand gets absorbed. The price here has reached its peak and there are just a bunch of last-time buyers getting into the market.
Downtrend/Markdown: Once the composite man has sold part of his assets CV l, the price and the market would be pushed down again by him and at this point, the demand won't be greater than the supply and the latter will have so much impact than the former and investors would want to sell their positions as the price will get extremely bearish.
In conclusion, we've seen how this particular method works and how the founder of this method strategized it to suite investors and traders need in terms of looking for market trends and price movements. I'll deliberate on how we can use this method in trading in my next post as I was just giving details on what the method is and how it works.
Disclaimer :Any financial and crypto market information provided in this post was written for informational purposes only and does not constitute 100% investment advice. It's just basic knowledge every crypto trader or investor should have


https://twitter.com/bossj23Mod/status/1719762369964855448?t=0-_dEDB3OG-vn2_DfhF1eQ&s=19
Downvoting a post can decrease pending rewards and make it less visible. Common reasons:
Submit
Dear @bossj23 ,
We appreciate your active participation and contributions to our community. To ensure a positive environment for all members, we have implemented a set of guidelines to maintain respectful and constructive discussions while upholding community guidelines.
It is not ideal to make a post on technical analysis without a proper image of price chart.
Please endeavor to price chart images to this kind of post
Now Engage, Connect, and Inspire Each Other to Reach New heights.
Thank You.
Downvoting a post can decrease pending rewards and make it less visible. Common reasons:
Submit
It would be continued in my next post. I was giving a preview of what it entails. I've used it in trading once
Downvoting a post can decrease pending rewards and make it less visible. Common reasons:
Submit