Hello Everyone,

Good afternoon everyone, how are you. I hope you all guys will happy and good. By the grace of God, I am also good. Today I am here with new post in which I am going to share my trades and market outcomes.
The cryptocurrency market is changing their behavior very quickly, uncertainly fear is at top level in the market. so keeping up with the latest trends is crucial for all traders and investors. In this post, we will discuss the recent price movements of BTC by using technical and fundamental analysis.
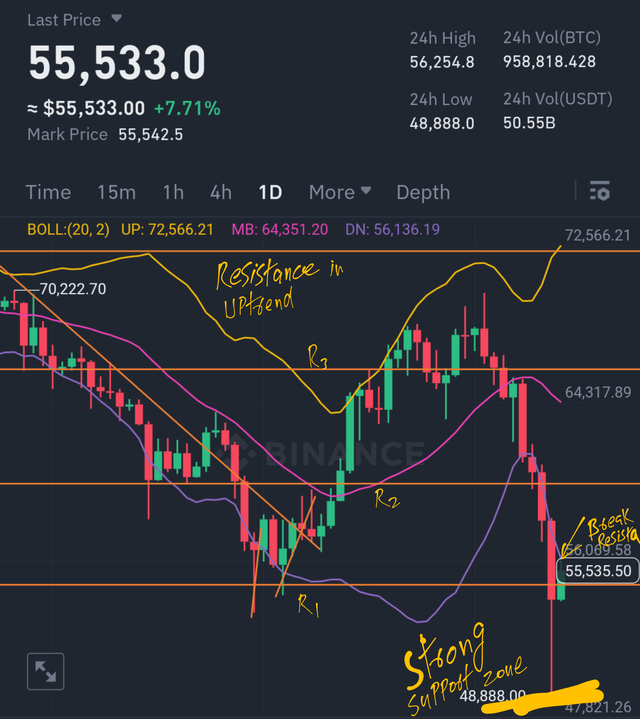
Currently, BTC price is at $55,533 which means its price has gone up by 7.71% in just the last 24 hour. It is a notable dump and pump in the last 24 hour. It is most important to measure the BTC volume in terms of trading for how much of a cryptocurrency has been bought and sold. 958818.428 BTC has been traded in the past 24 hours. Trading volume is 50.55 billion in USDT that means high trading volumes show that there is a lot of activity and interest in the cryptocurrency market right now.

Technical Analysis
Bollinger Bands is my Favorite indicator, I mostly use it for swing trading and for scalping.
Upper Band : $72,566.21
Middle Band : $64,351.20
Lower Band : $56,136.19
These band show that according to 1 day candle stick, bottom price of BTC will 56k and middle price of BTC will 64k. in the upcoming days and hours, we will see that BTC will touch the middle band. yesterday, BTC take a biggest dump without any major news and events. it liquidate the longer and hit the 48800$ level.
Relative Strength Index
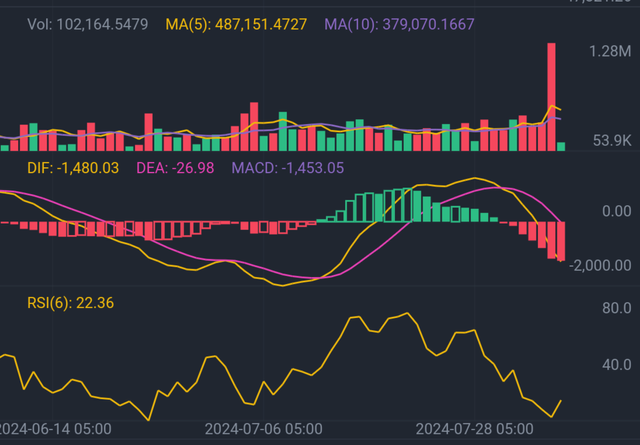
RSI Indicator helps to track the speed and change of price movements. In the 1-day chart, RSI of BTC is at 22.36.

This low number indicates that BTC is in the oversold territory due to yesterday big dump. RSI indicate that BTC is in oversold and it often suggests that the price might go up soon as traders start buying it at a lower price as an opportunity.
Support and Resistance Levels
Support Level 1: $47k to $48k
Resistance Level 1: 53k to 54k
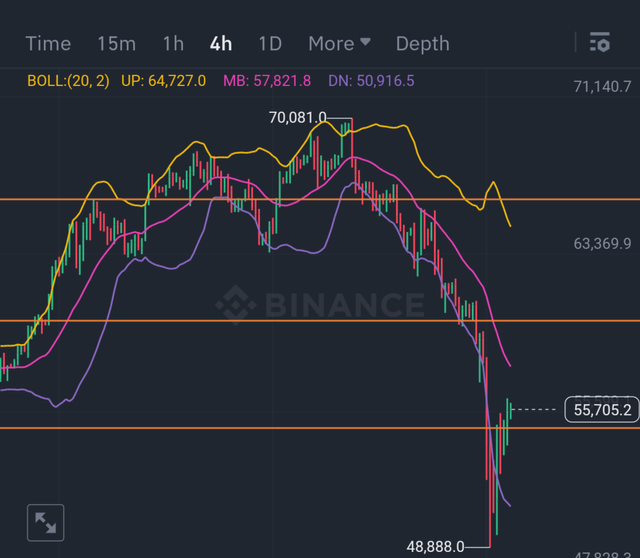
The price recently touched the support level and bounce back that indicating strong buying zone at this level. Now it successfully break the level 1 resistance and trading at 55700$. the next support and resistance level is mentioned below.
Support Level 2: 53k to 54k
Resistance Level 2: $56k to $57k
Many other support and resistance levels are mentioned in the chart below.

I hope it will be an interesting topic for crypto lover. It would be my pleasure if you will share your opinion and reviews on this topic.

Please cast witness vote to @bangla.Witness or set proxy to @rme.
_
Vote @bangla.witness as witness
Set Proxy @rme as proxy
Special Thanks.
Cc: @rme
Cc: @hungry-griffin
Thanks for giving your precious time to my post.
Follow | Upvote | Share | Comments
Follow me on Instagram.
Instagram
🆃🅷🅰️🅽🅺 🆈🅾️🆄
X Promotion Post.
https://x.com/alimhr96/status/1820720695997092065?t=AEhEloUkb0k2SCh2xTnP-g&s=19
Downvoting a post can decrease pending rewards and make it less visible. Common reasons:
Submit