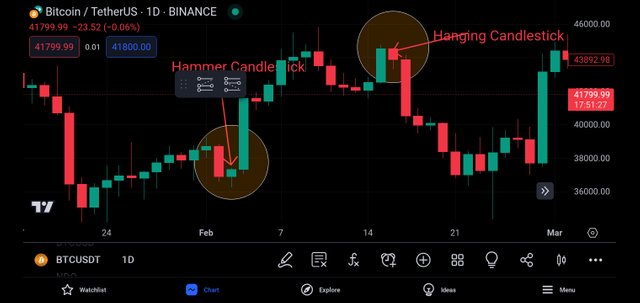
As a trader, each time you want to analyze the crypto or forex market, you will like to know when a hammer candlestick and hanging candlestick are formed, to get a clearer view of the market so you can know the end of a downtrend and uptrend moves.

Screenshot gotten from Tradingview app
In these two candlesticks, we want to look into, both are similar, but the colors and how their end is what makes them to be different from each other. Without delaying you with many words let's get to understand what hammers and hanging candlesticks are:
| Hammer Candlestick |
|---|
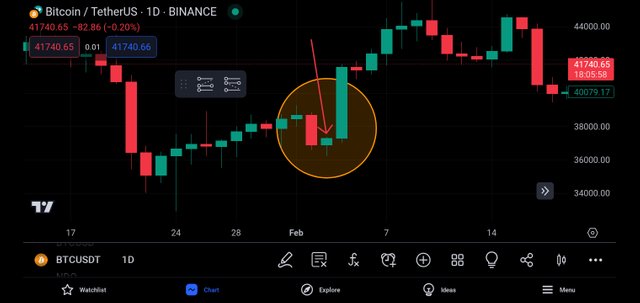
The Hammer Candlestick is in a green color whereas in some charts you will see it in white no matter the color that you see you should know is a bullish reversal candlestick pattern that forms when there is a downtrend.
The reason why the hammer is seen at the end of a downtrend is because the market is trying to leave the bottom and move upward.

Screenshot gotten from Tradingview app
The hammer candlestick is characterized by a tiny body, with a single bar, which can either be bearish or bullish as it is usually tiny each time the candle is forming, with a long shadow.
Without much saying, it is just like a hammer, that has a big head and long hand. In a hammer, sometimes the shadow is short or may not be shown no matter how you see it you should know that it represents the high price which is equal to the closing or opening price of the asset you are analyzing.
A bullish signal is what a hammer candlestick provides whenever you see that there is a hammer candlestick at the bottom, of a strong support level, you should know it is because of a potential reversal from a bearish trend to the bullish trend.
| Hanging Man Candlestick |
|---|
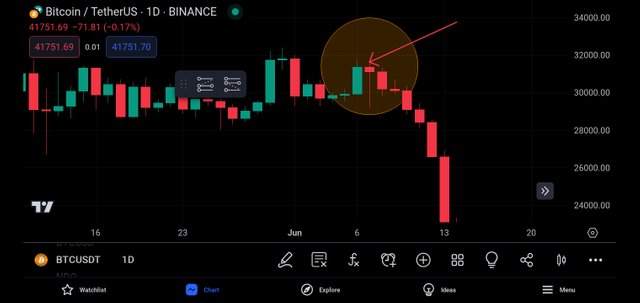
The Hanging Man Candlestick is red whereas in some charts you will see its color in black, which no matter the color that you see you should know is a bearish reversal candlestick that is formed when there is an uptrend.
The reason why the hanging man candlestick is seen at the top of an uptrend is that the market is trying to fall leaving the top which is bullish to the bearish bottom.

Screenshot gotten from Tradingview app
Also, just like the hammer, it is characterized by a tiny body, with a single bar, which can either be bearish or bullish with a smaller shadow which is shown most time.
What you need to know is that the hanging man candlestick is the candlestick that forms a bearish signal, whenever you see that there is a hanging man candlestick at the top of a strong resistance level, you know it is because of a potential reversal from the bullish trend to the bearish trend.
Conclusion
In this post, we have discussed the two candlesticks that look much alike on a chart the help of what we have learned here, you can be able to identify them to know when you are to open a buy or sell order. This post is purely for educational purposes and nothing more.
Thank you, friend!


I'm @steem.history, who is steem witness.
Thank you for witnessvoting for me.
please click it!
(Go to https://steemit.com/~witnesses and type fbslo at the bottom of the page)
The weight is reduced because of the lack of Voting Power. If you vote for me as a witness, you can get my little vote.
Downvoting a post can decrease pending rewards and make it less visible. Common reasons:
Submit
https://x.com/AkwajiAfen/status/1751135567264268367?s=20
Downvoting a post can decrease pending rewards and make it less visible. Common reasons:
Submit
Note:- ✅
Regards,
@theentertainer
Downvoting a post can decrease pending rewards and make it less visible. Common reasons:
Submit