.png) Made with canvas
Made with canvasWhether you are a crypto or forex trader, it is good that you know how to use RSI to signal when to enter trades. As we introduced in our lesson one, where we introduced the RSI and how to apply it, today in our lesson 2, we will be looking at the right time to use the RSI to signal when you are to take a crypto trade.
Before going further, be reminded that the Relative Strength Index (RSI) indicator is what traders use to measure the strength of a currency pair by monitoring the change in the closing price of the traded currency. In doing this, you will get to know the levels of overbought and oversold. To this ;
- Overbought is when the RSI line is above 70%, whereas
- Oversold is when the RSI line is below 30%.
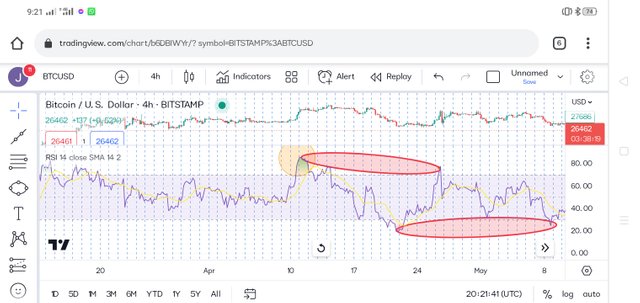
All this has been explained in our previous lessons. Having said that, let's get going with today's lesson. Ahead! Ahead!! No stopping. Now, looking at the chart of BTC/USD below, you will see that traders are selling the trader currency after the RSI moves above the 70 horizontal lines and falls below the line.

In the example above, a trader would like to enter a long trade once the RSI falls below the 30 horizontal lines and then moves above the line. You can also see that the traded currency moved strongly until the RSI moved above the 70 horizontal lines before it fell below and formed a sell signal.

From the 4 hours chat of BTC/USD, there was a significant move in BTC/USD, which was trading around $30,000, which is the level of overbought, before traders began selling off their holdings up to the level of $26,4200, which is oversold. All this is indicated on the chart above.

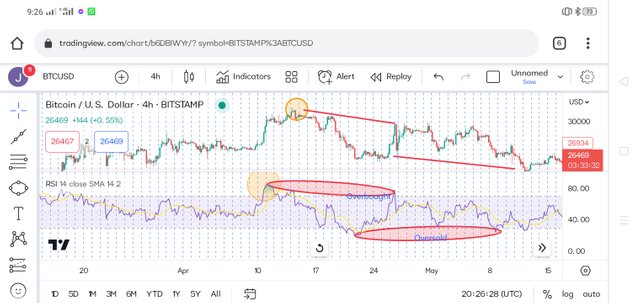
Looking at the chart above BTC/USD, the RSI line rises above 80%, which is a very strong bullish trend, meaning buyers were in control of the market before sellers took over the market. At the point when the RSI changes direction and breaks above and below the trend line, a significant move in price results.
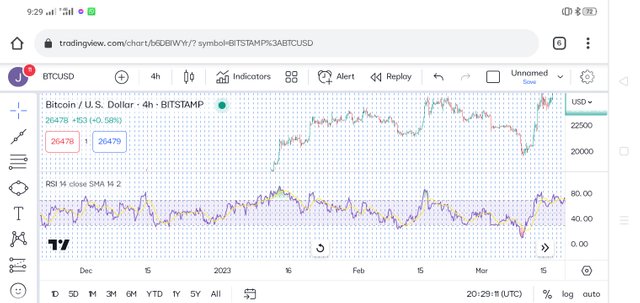
In the above chart of the very same 4-hour chart of BTC/USD as previously used, the trend line breaks and identifies many setups. The use of the trend line is what then provides more additional information and confirmation to traders that a trade opportunity is about to open. The trend line also helps the trend line break because it has buy and sells confirmation signals on the candlestick before the main move.
Screenshots Gotten From Tradingview
I also invite you to support the witnesses who focus on community development, they are @bangla.witness @visionaer3003, Please review and vote for them as witness !
Via steemit wallet https://steemitwallet.com/~witnesses
Via steemworld https://steemworld.org/witnesses?login

Vote for @bangla.witness via steem connect https://steemlogin.com/sign/account-witness-vote?witness=bangla.witness&approve=1

Best Regards
@josepha
Cc:
@stephenkendal
Thank you for your contribution to the community. Keep on sharing quality original posts and please read our how-to posts which have been pinned in the community.
Nice review, we hope you can maintain a professional quality post if you want to share relevant topics in the Steem Alliance community.
Increase your Engagement in the community to exchange ideas and interact with teams from various communities.
Please always review the posts we have pinned on the community page. There are many guides that you should know, and they will be very useful.
Rating : 7/10
have a nice day!
Downvoting a post can decrease pending rewards and make it less visible. Common reasons:
Submit
https://twitter.com/AkwajiAfen/status/1662111836966141954?s=20
Downvoting a post can decrease pending rewards and make it less visible. Common reasons:
Submit