made by canva
Hello Everyone.
I am @mostofajaman from Bangladesh .
Assalamu Alaikum I hope everyone is well today I come to you with an important start strategy of trading. All of you have seen this title and must have understood what strategy I will talk about. Let's take a look at the origins of Fibonacci trading.
Leonardo Bonacci was an Italian mathematics scientist. He gave a sequence in the 13th century. He said that this sequence can be applied to everything in the world, such as the human body, trees, plants, even tornadoes, even in the solar system. So this sequence was named the "Fibonacci" sequence. Leonardo Bonacci said his sequence would work everywhere. So those trading also wanted to apply it to see if it works. After applying it, it is seen to be working very well. Since then this sequence has been used in trading strategies and is called “Fibonacci”. Below I am giving its formula in source form.
How to Calculate Fibonacci Retracement Levels, As discussed above, there is nothing to calculate when it comes to Fibonacci retracement levels. They are simply percentages of whatever price range is chosen. However, the origin of the Fibonacci numbers is fascinating. They are based on something called the Golden Ratio. Start a sequence of numbers with zero and one. Then, keep adding the prior two numbers to get a number string like this: 0, 1, 1, 2, 3, 5, 8, 13, 21, 34, 55, 89, 144, 233, 377, 610, 987...with the string continuing indefinitely. The Fibonacci retracement levels are all derived from this number string. After the sequence gets going, dividing one number by the next number yields 0.618, or 61.8%. Divide a number by the second number to its right, and the result is 0.382 or 38.2%. All the ratios, except for 50% (since it is not an official Fibonacci number), are based on some mathematical calculation involving this number string. Source
.png)
made by canva
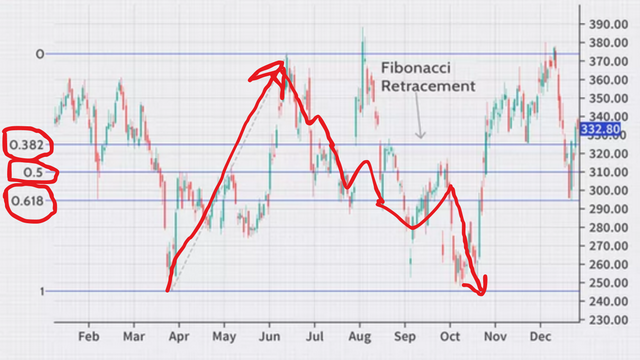
The first thing is that we will use them for trading. It is mainly used to understand retracement or down-trend markets. If you use it, you will definitely understand whether the market is taking retracement or going downtrend. Above I have made a drawing where you can understand about its use. The price of any token or share never goes up and never suddenly goes down. In the up trend, the share value and the candlestick gradually rise up and rise again like a retest. And the candlestick of the value shares of the downtrend comes down slowly and goes up a little and then comes down again. Keep coming down like this. Then we do not understand it has gone to Drown trend.
If you go to trading view or binance trading view, you can see here Fibonacci indicator. I have drawn everything in the screenshot.


Screenshort from binance
I was surprised myselby f that using the Fibonacci indicator on each candle stick, the replacements seemed to be setup. I have shared the screenshots via binance. After trading you will get an indicator named Auto Fibonacci from where you can see it.
Take a look at the numbers 0.236, 0.382, and 0.618 to the left. Each of the retests that hit here sometimes went down and then went back up. This could be a nice opportunity for you to consider if the market moves below the 0.786 line. Entry will not be taken if it has gone down trading. In addition to this, you can draw support resistors and support lines to analyze the market.
By using it properly we can write down the advantages of trading. This will give us many opportunities to retest or down trand the market and bring buying opportunities. I thank the inventor of this thank you everyone be well everyone.


X promotion link
https://x.com/MostofaJaman5/status/1756950166421262516?s=20
Downvoting a post can decrease pending rewards and make it less visible. Common reasons:
Submit