Greetings fellow steemist writers, in this analysis I will present the objective of remote trend lines in commerce and explain their meaning when identifying market trends and possible commercial opportunities.

Understand trend lines ?
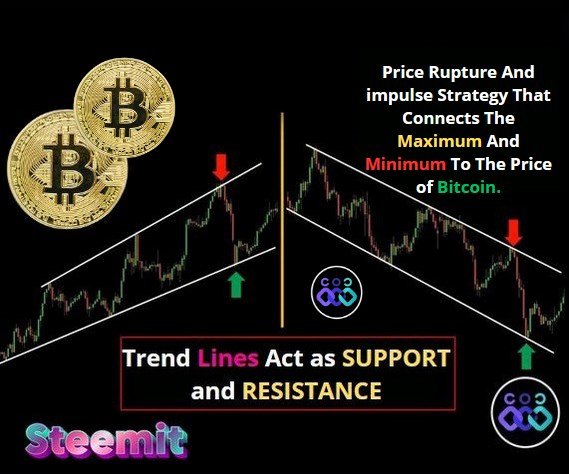
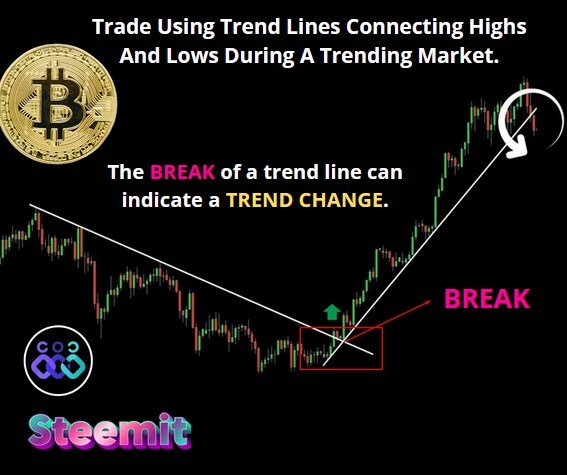
Trend lines are drawn connecting highs and lows during a trending market.
These trend lines can act as support or resistance levels when the price touching them is indicating possible trading opportunities.
A break or bounce on a trend line can indicate a possible change in trend and can provide valuable information for traders.
Trendline Strategies with Price Action ?
Employ trend lines with price action for continuation and reversal trading strategies.
Identify areas of confluence where multiple operators are concentrated, increasing the probability of successful operations.
Waiting for confirmation of price action before placing trades based on trend line interactions.

Breakout Strategy and Price Momentum ?
- Use breakout patterns when prices break trend lines to indicate potential changes in market direction.
In-depth analysis of trend lines in trading ?
The importance of trend lines in trading is discussed here, focusing on identifying trend changes and potential buying or selling opportunities based on specific patterns observed.
Identify bearish trend reversal ?
In a downtrend, seeing a higher low amid lower lows indicates a loss of momentum.
The breakout of the trend line further confirms the trend change and presents a buying opportunity.
Combining trend breaks with double rejections improves analysis efficiency.
Recognize bullish trend reversal ?

If the previous highs are not broken, a double top reversal pattern is formed, indicating rejection and loss of momentum.
Breaking the trend line after the pattern confirms a trend change, suggesting short positions.
Detect downtrend reversal signals ?
Failure to establish lower lows along with a double bottom formation means a loss of bearish momentum.
Breaking the trend line after the pattern validates the trend reversal, indicating an opportunity for long positions.
Key takeaways.
Effective utilization of trend lines can help identify potential trading opportunities.
Understanding various reversal patterns, such as double tops and bottoms, is crucial for decision making.
✅ Vote @bangla.witness as lead witness please.
Thank you for reading me grateful.....
.gif)

Let's remember to comment on my publication, I will gladly answer you.
This article is written by @OscarDavid79 free of copyright
https://twitter.com/oscardavidd79/status/1772011862642643440
Downvoting a post can decrease pending rewards and make it less visible. Common reasons:
Submit
Upvoted! Thank you for supporting witness @jswit.
Downvoting a post can decrease pending rewards and make it less visible. Common reasons:
Submit
Thank you for supporting
Downvoting a post can decrease pending rewards and make it less visible. Common reasons:
Submit
Note:- ✅
Regards,
@jueco
Downvoting a post can decrease pending rewards and make it less visible. Common reasons:
Submit