.png)

The Inverse Head and Shoulders Pattern is a common technical analysis pattern used in financial markets, particularly in the stock and forex markets & also the Crypto Market. It is a bullish reversal pattern that typically signals a change in the direction of the price trend, from a bearish trend to a bullish trend.
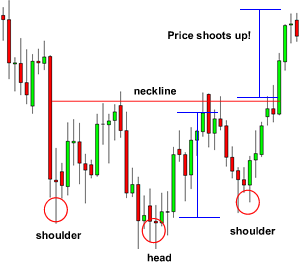
The pattern is formed by a series of three successive troughs, with the middle trough (the head) being lower than the two shoulders on either side. The left shoulder is formed when the price falls and then rebounds, and the head is formed when the price falls again, but this time to a lower level than the left shoulder. The right shoulder is then formed when the price rises, falls, and then rises again to a level that is not as high as the head.
When the price breaks above the neckline, which is a horizontal line connecting the highs of the left and right shoulders, it is considered a bullish signal. This signals that the price has reversed from a downtrend to an uptrend, and the price is expected to rise further.

Traders and analysts often use the inverse head and shoulders pattern to identify potential buying opportunities. However, it is important to note that the pattern is not always reliable and can sometimes lead to false signals. It is important to consider other technical indicators and market factors before making any trading decisions.
In addition to identifying potential buying opportunities, traders can also use the inverse head and shoulders pattern to set price targets. The height of the pattern, measured from the lowest point of the head to the neckline, can be used to determine the potential price increase that may occur after the breakout. The price target is often set at a distance equal to the height of the pattern added to the neckline.
While the inverse head and shoulders pattern is most commonly used in financial markets, it can also be applied in other industries. For example, it can be used in marketing to identify potential opportunities for a product or service. Similarly, it can be used in manufacturing to identify potential production trends.
In conclusion, the inverse head and shoulders pattern is a common technical analysis pattern used in financial markets to identify potential buying opportunities and set price targets. Traders and analysts should be aware that the pattern is not always reliable and should consider other technical indicators and market factors before making any trading decisions.
VOTE @bangla.witness as witness

OR
Thanks.

Thank you, friend!


I'm @steem.history, who is steem witness.
Thank you for witnessvoting for me.
please click it!
(Go to https://steemit.com/~witnesses and type fbslo at the bottom of the page)
The weight is reduced because of the lack of Voting Power. If you vote for me as a witness, you can get my little vote.
Downvoting a post can decrease pending rewards and make it less visible. Common reasons:
Submit
Downvoting a post can decrease pending rewards and make it less visible. Common reasons:
Submit