Hello everyone I am @shahariar1 mod of Steem of Animals Community.I am From #Bangladesh
Today I am going to discuss an important Single Candle Street Pattern in the East Stock Market. I will try to present the matter in very simple language. You can easily identify bull market and bear market by looking at this Single candlestick chart pattern.
 |
|---|
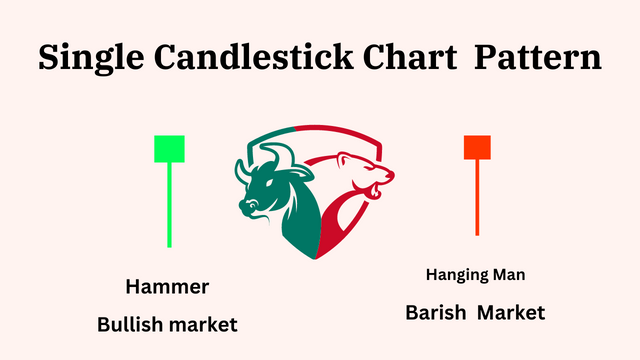
The two candles you see in the cover photo are what I call a bullish pattern and the other a bearish pattern. Green pattern indicates bullish market and red pattern indicates bearish market.
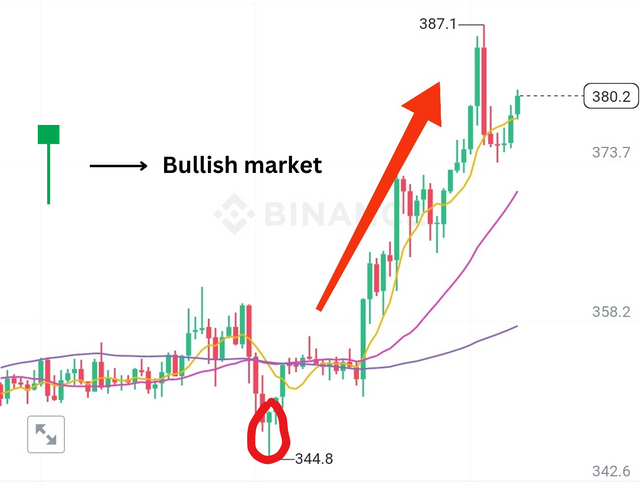
Let's discuss in detail : "Hammer"
Hammer pattern is very important pattern if you are in stock market. It definitely gives the sign of market police. Each pattern depends on the market volume. A bullish market cannot be caught if it is created and the market volume does not increase. But if this hammer pattern is formed and the market volume continues to rise then AAT definitely gives a bullish market indicator. However, this indicator should form at the bottom of the chart. It works in reverse if it forms at the top of the chart. Bearish market begins.
One thing to keep in mind is that all bullish patterns are formed at the bottom of the chart. And all bearish patterns form at the top of the chart.
 |
|---|
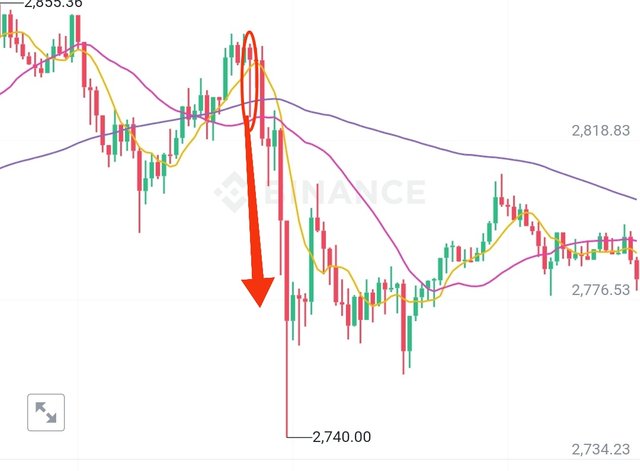
Let's discuss in detail : "Hanging Man"
The red color candle you can see on the right side is always a bearish market indicator. There is consistency with the volume. This pattern is formed in the tub of the chart and the 42 market does not start unless the market volume decreases. But if this candle is formed in the trope of the chart and the market volume continues to decrease, it definitely gives a bearish indicator. Although this is a bearish pattern, if it forms on the bottom of the chart, it will definitely signal a bullish market. It will give the 42 market sign only when it forms at the top of the chart.
 |
|---|
I tried my best to explain you about the two patterns. Later I will discuss in detail where to take the anti and where to place the stop loss after this pattern is formed. Hope you like my content.
VOTE @bangla.witness as witness

OR
Cc,
@rme .
@hungry-griffin.
X promote :
https://x.com/Shahari73599011/status/1760576622594334910?s=20
Downvoting a post can decrease pending rewards and make it less visible. Common reasons:
Submit
Note:- ✅
Regards,
@theentertainer
Downvoting a post can decrease pending rewards and make it less visible. Common reasons:
Submit