It is another brown new day to share my knowledge and insight about a topic which I believe will be helpful to us Steemians especially those of us who are into crypto trading and analysis. Day in day out we try our best to explore more indicators that will assist us in getting a maximum output when we apply them to our trade.

Background image Edited on Canvas
Today is not an exception as I will want us to look at one of the indicators I have recently come across which has proven to be effective based on the signals it help to provide for me in the market. I will also do a mathematical calculations on how these values on the indicator are gotten.

| Introduction to the Fisherman Transformer indicator |
|---|
You know that every indicator has a mathematical proof support it theory and if it is not mathematically proven then it cant be used as a standard and that is why today we are going to be looking at the application of the mathematical theory of how these indicator operates in the article.
Before we proceed, it is important to mention here that the Fisherman transformer indicator is a trend based indicator which is made up two oscillator lines called the Fisher and the trigger. Usually the indicator has a range of -1 to 1 which means that if the indicator moves close to 1 it implies a strong uptrend movement and if the indicator moves close to -1 it indicates a strong downtrend.
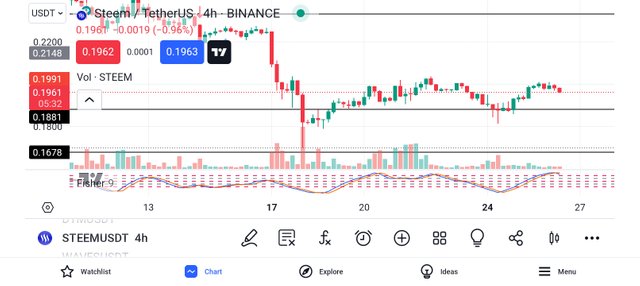
Aside these lines we also have 5 horizontal lines with the third line as the middle line or the 0 line or the center where the market is said to be at a range. So there are lots of components involved when calculating these indicator and it is mostly seen as a complex mathematical calculations but I will break it down to our understanding.
| How to calculate the Fishermen Transformer indicator |
|---|
There are basically 5 ways to calculate the Fishermen Transformer indicator and these steps are seen below. Firstly what you will be given and the parameters you will need to search for include
Highest High (HH)
Lowest Low (LL)
Midpoint (M)
Raw Fisher Value (RF)
Fisher Value (FV)
Fisher Transformer (FT)
So these are the parameters that you need when you want to carry out the calculation of the Fisherman Transformer (FT). Before getting the value of FT, you need to get all the above like the Midpoint (M), Raw Fisher Value (RF), Fisher Value (FV). So below let's see the formula that we can use to get them one after the other.
 |  |
|---|
For HH and LL you can pick a period and have the values of HH and LL e.g period 2
For Midpoint (M) = (HH + LL) / 2
For Raw Fisher Value (RF) = (Current Price - M) / (HH - LL)
For Fisher Value (FV) = (RF + (0.5 * Previous FV)) / (1 + 0.5)
For Fisher Transformer (FT)= (FV * 2) - 1
| Calculation application Sample |
|---|
Let's consider the data given below as a case studies on how we can effectively calculate Fisher Transformer. So we will use all the steps below to calculate for each period and also conclude if the market at that stage is a strong uptrend or a strong downtrend or just a trend that is in a range.
| Period | High | Low | Close | HH | LL | M | RF | FV | FT |
|---|---|---|---|---|---|---|---|---|---|
| 1 | 100 | 90 | 95 | 100 | 90 | ||||
| 2 | 105 | 98 | 102 | 105 | 90 | ||||
| 3 | 110 | 100 | 109 | 110 | 100 | ||||
| 4 | 115 | 102 | 116 | 115 | 105 | ||||
| 5 | 140 | 130 | 138 | 140 | 130 |
Calculate the Values for the following unknown and then find the FT.
Solution
For period 1
Given
HH = 100, LL = 90
Midpoint (M) = (HH + LL) / 2
M = (100 + 90) / 2
M = 190 / 2
M = 95
For Raw Fisher Value (RF) = (Current Price - M) / (HH - LL)
RF = (95 - 95) / (100 - 90)
RF = 0
For Fisher Value (FV) = (RF + (0.5 * Previous FV)) / (1 + 0.5)
FV= (0 + (0.5* Previous FV)) / (1 + 0.5)
No previous FV
FV = (0 + (0.5 )) / (1 + 0.5)
FV = (0.5) / (1.5)
FV = 0.333 to 3 d.p
For Fisher Transformer (FT)= (FV * 2) - 1
FT = (0.333 * 2) - 1
FT = -0.333 to 3 d.p which means that the market at this level is in a strong downtrend.
So haven gotten the values for period 1 we can go ahead to fill the Colum for M, RF, FV and FT respectively. You can go ahead to do for period 2, 3, 4 and 5 respectively.
The Fisherman Transformer indicator as you can see has a bit of complex calculation and it consumes a lot of time as well. If we go on and on to calculate the remain periods then we may not finish today. If you wish to try you can use the data I have presented above and follow the sample of period 1 to see if you can arrive at the FT of period 2, 3, 4 and 5 respectively.
This tutorial is just a sample guide for you to know how this indicator works. I hope you understand it and you can give it a trial. If you have any question, the comment section of this post is open. Please ask your quest and I will do my best to attend to it ASAP.
Finally, I want to thank you all for reading through my post today. If you have any questions or contributions, please do well to use the comment section of this post. See you all in my next publication.
Disclaimer: This post is made as an education and not investment advice. Digital asset prices are subject to change. All forms of crypto investment have a high risk. I am not a financial advisor, before jumping to any conclusions in this matter please do your research and consult a financial advisor.
NB: All images except otherwise stated are mine and taken from the Kucoin application.
Thank you, friend!


I'm @steem.history, who is steem witness.
Thank you for witnessvoting for me.
please click it!
(Go to https://steemit.com/~witnesses and type fbslo at the bottom of the page)
The weight is reduced because of the lack of Voting Power. If you vote for me as a witness, you can get my little vote.
Downvoting a post can decrease pending rewards and make it less visible. Common reasons:
Submit
https://x.com/xavierf14044615/status/1805936930707693616?t=T-OQIoT7urRgH1smpFh38A&s=19
Downvoting a post can decrease pending rewards and make it less visible. Common reasons:
Submit
Note:- ✅
Regards,
@jueco
Downvoting a post can decrease pending rewards and make it less visible. Common reasons:
Submit